Welcome to the support center of VolFix

 Работа с auto buy, auto sell при включенной настройке (выставление sl, tp) в orders setup
Auto buy, auto sell - включена опция выставления тейка и стопа ( state ON в Order setup).
Пример:
На графике Orders window сверху, справа указано, что активен auto buy (AB).
Выставляю лимитный бай заявку.
Ордер закрывается.
На графике по-прежнему стоит признак активности auto buy (AB).
НО, если выставляю новую лимитную заявку, но теперь выставляется sell limit.
Как понимаю, такое поведение удобно, когда работаешь без автоматически выставляемых стопов и тейков.
Тогда прошу добавить проверку:
Если в auto sell, auto buy - включена настройка выставления тейков и стопов (state ON), то не менять активность AB --> AS (AS --> AB) после срабатывания ордера.
 Сохранение настройки "перекрестия" в layout
При сохранении layout'а, не сохраняется настройка:
- вкл перекрестие,
- вкл глобального перекрестия.
Неудобно каждый раз при загрузке layout'а, заново включать перекрестие, глобальное перекрестие.

Добавление Японских Свечей
Пожалуйста сделайте график обычных японских свечей
хотя бы только в окне ордеров.
уже и трендовые и линии и фибо есть
а свечек.
очень не хватает.
рассмотрите пожалуйста этот вопрос.
спасибо
с уважением!

DOM +Dom delta type Self
Есть ли возможность добавить в модуль Trading DOM , Dom delta type -Self, как сделано в стакане? Было бы информативнее, когда видно, как убираются и добавляются заявки и даже возможно исключило бы совсем использования DOM на графике

размер шрифтов уменьшается при включенном Open GL
почему размер шрифтов так сильно уменьшается если включить OpenGL?
особенно это заметно на экранах высоким разрешением (в частности на ноутбке с разрешением 2736х1824)
прошу исправить

improvement T/S Target
When reaching 4 pips, SL is put on debut and only at the 6th pip, the T / S target is placed on 2 pips above the start.
If the trade goes further into the +, then the SL remains above the debit at 2 pips and does not go along anymore.
Improvement:
1. After reaching the Stops stop, the T / S Target should jump to the set value and not before the debut. Or. This startup setup does not have to be removed, but it could be an option that you could disable / enable.
2. After T / S Target has seized, it should continue to actively move with the trade for example in the amount of the Trailing Stop number or better yet, you can set yourself by how many pips this should move and would not depend on the previously set Trailing Stop size.

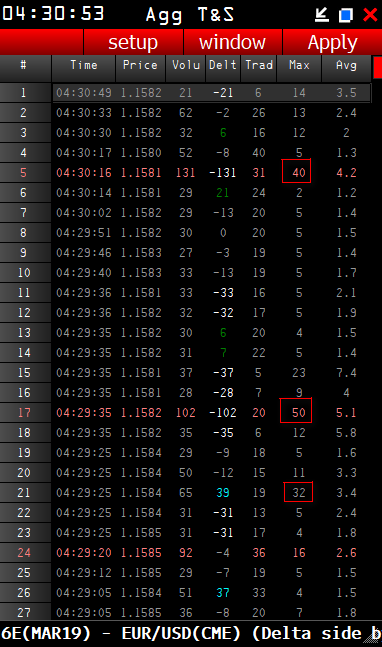
Лимиты в Ленте
Можно ли модернизировать AGG ленту, чтобы была возможность выделять максимальные трейды, как показал на скрине?

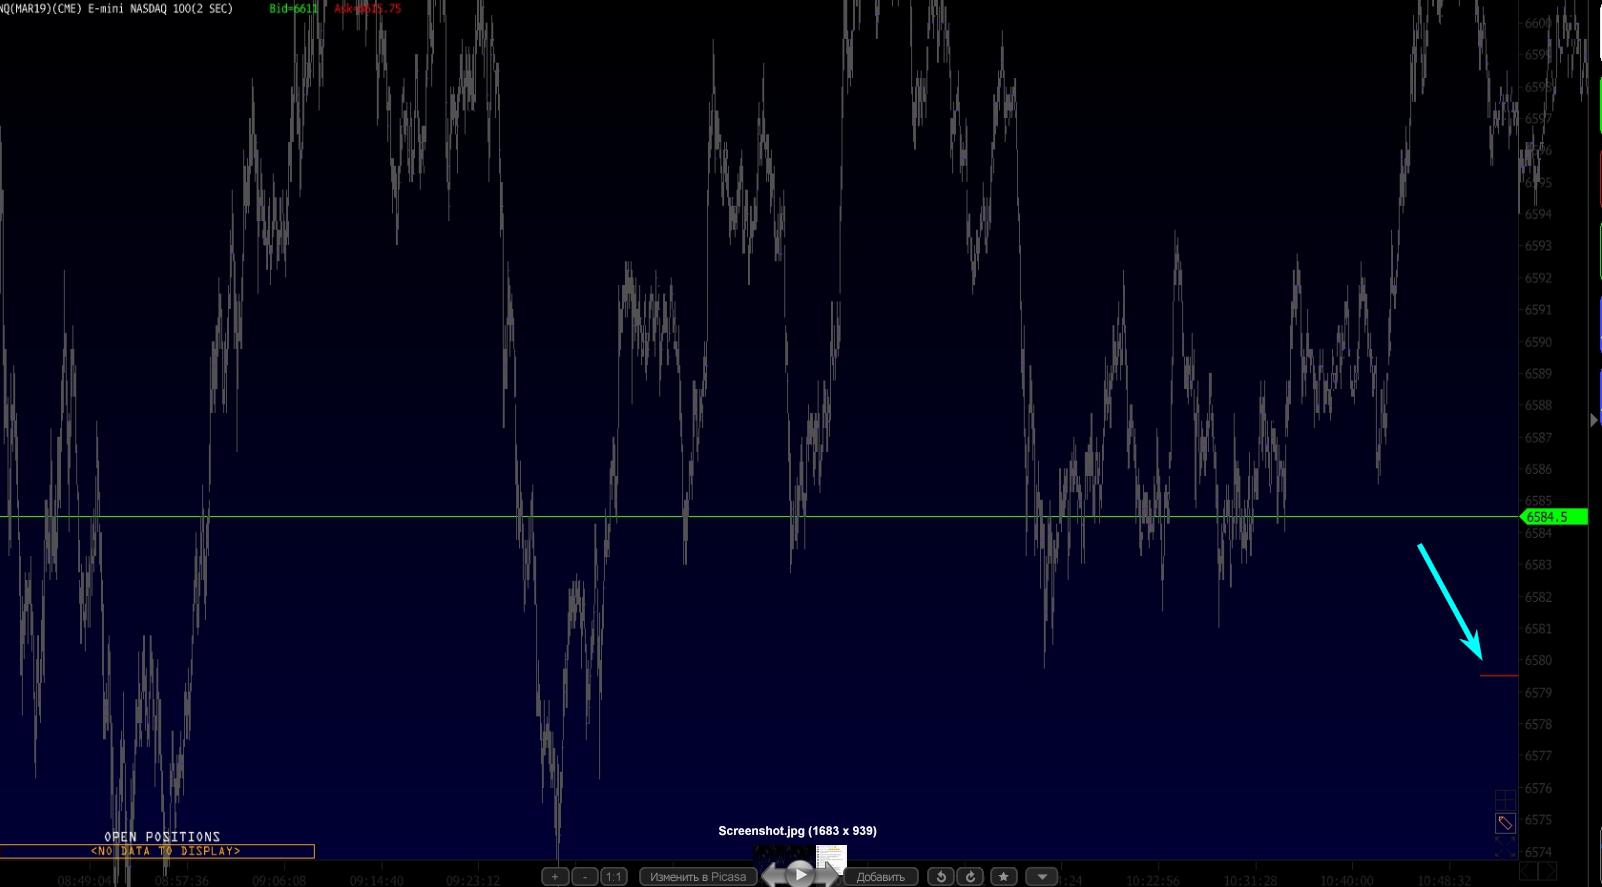
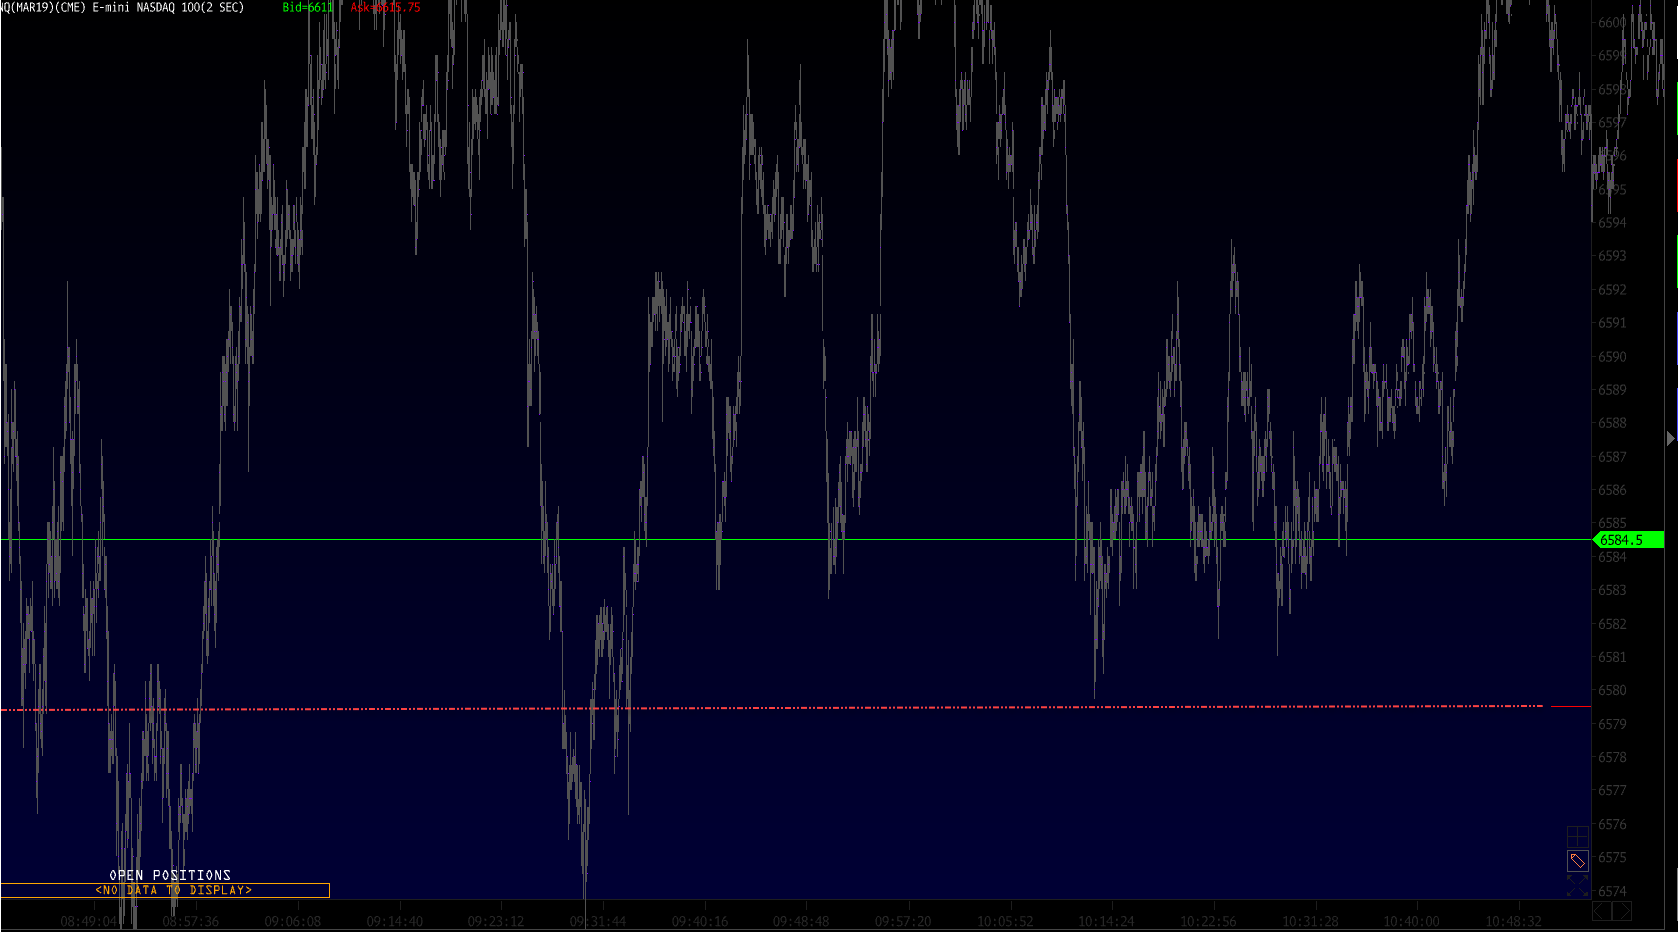
Отображение пунктирной линии
Здравствуйте! Ставлю линию в кластер профайл, делаю ее пунктирной, а отображается сплошная,в бокс чарт то же, перезаход в платформу результата не дал. В маркет вотч отображается правильно пунктирная линия (если выбрать пунктир)

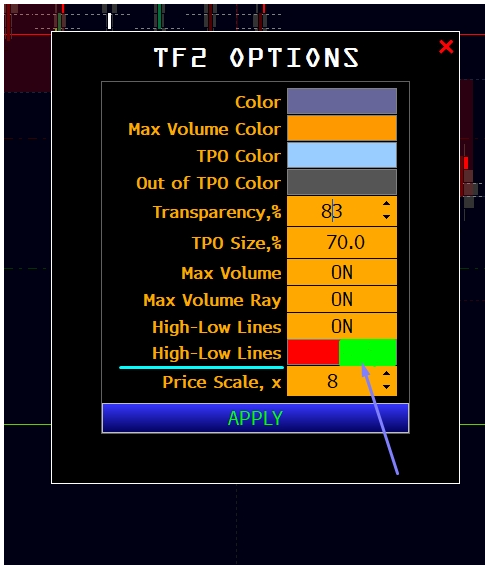
TF2 OPTIONS
Здравствуйте.
Уважаемые разработчики, будьте так любезны, доработайте немного модуль TF2 OPTIONS как это показано на скрине, очень нужная вещь.
Заранее благодарен.
Customer support service by UserEcho