Welcome to the support center of VolFix

 High / Low Line Horizontal Histogram - Volfix Anywhere
Good Morning team Volfix,
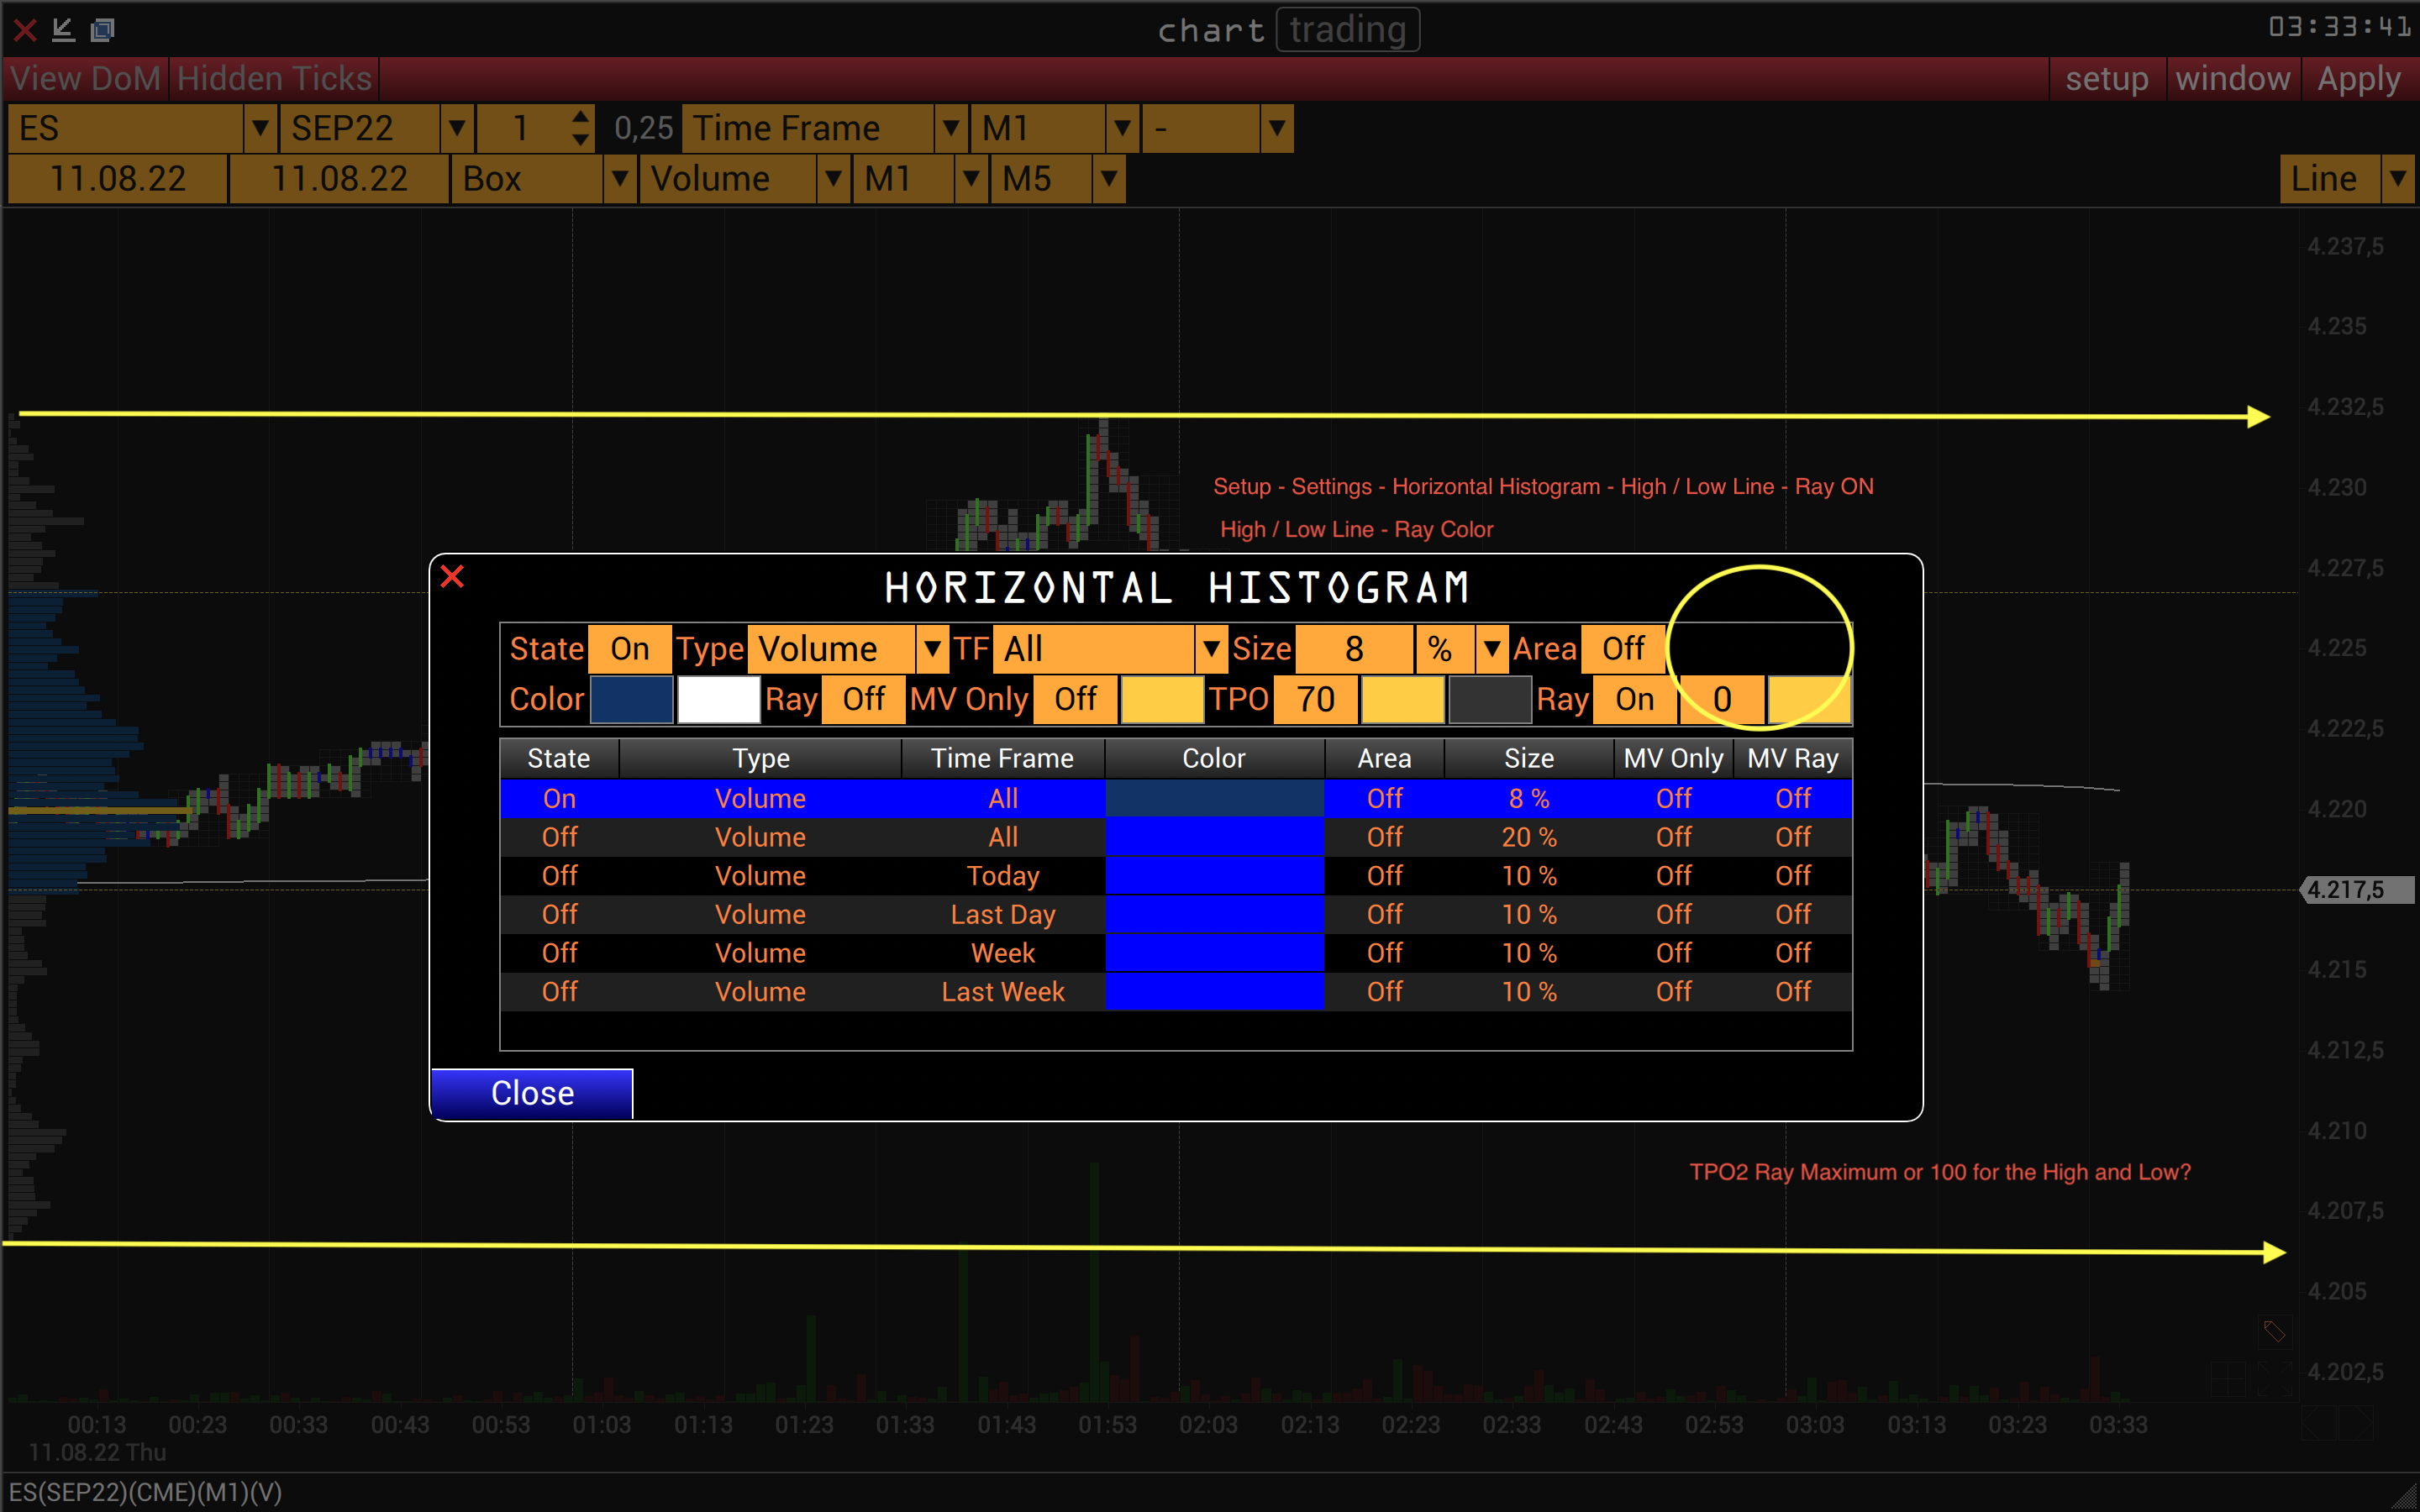
Is it possible to program a setting to Draw a High / Low Line in Horizontal so that you see can see the High / Low of a specific TF instantly? Color?
Tried it with TPO2 Settings but the max Value is 99 so the Line is not on the High / Low and a Ray is not possible.
If its possible to set TPO2 to MAX (High and Low) and make a Setting Ray On/Off it also would be ok.
I made a picture for better understanding.
Thank you for your good and fast Support

Переключение типа линий
При выключенной контрольной панели на графике невозможно переключить тип линии - с линии, которая служит просто уровнем, на линию, которая является алертом.
Volfix Anywhere - Cluster Chart "Wicks"- Volume Range
Good Evening,
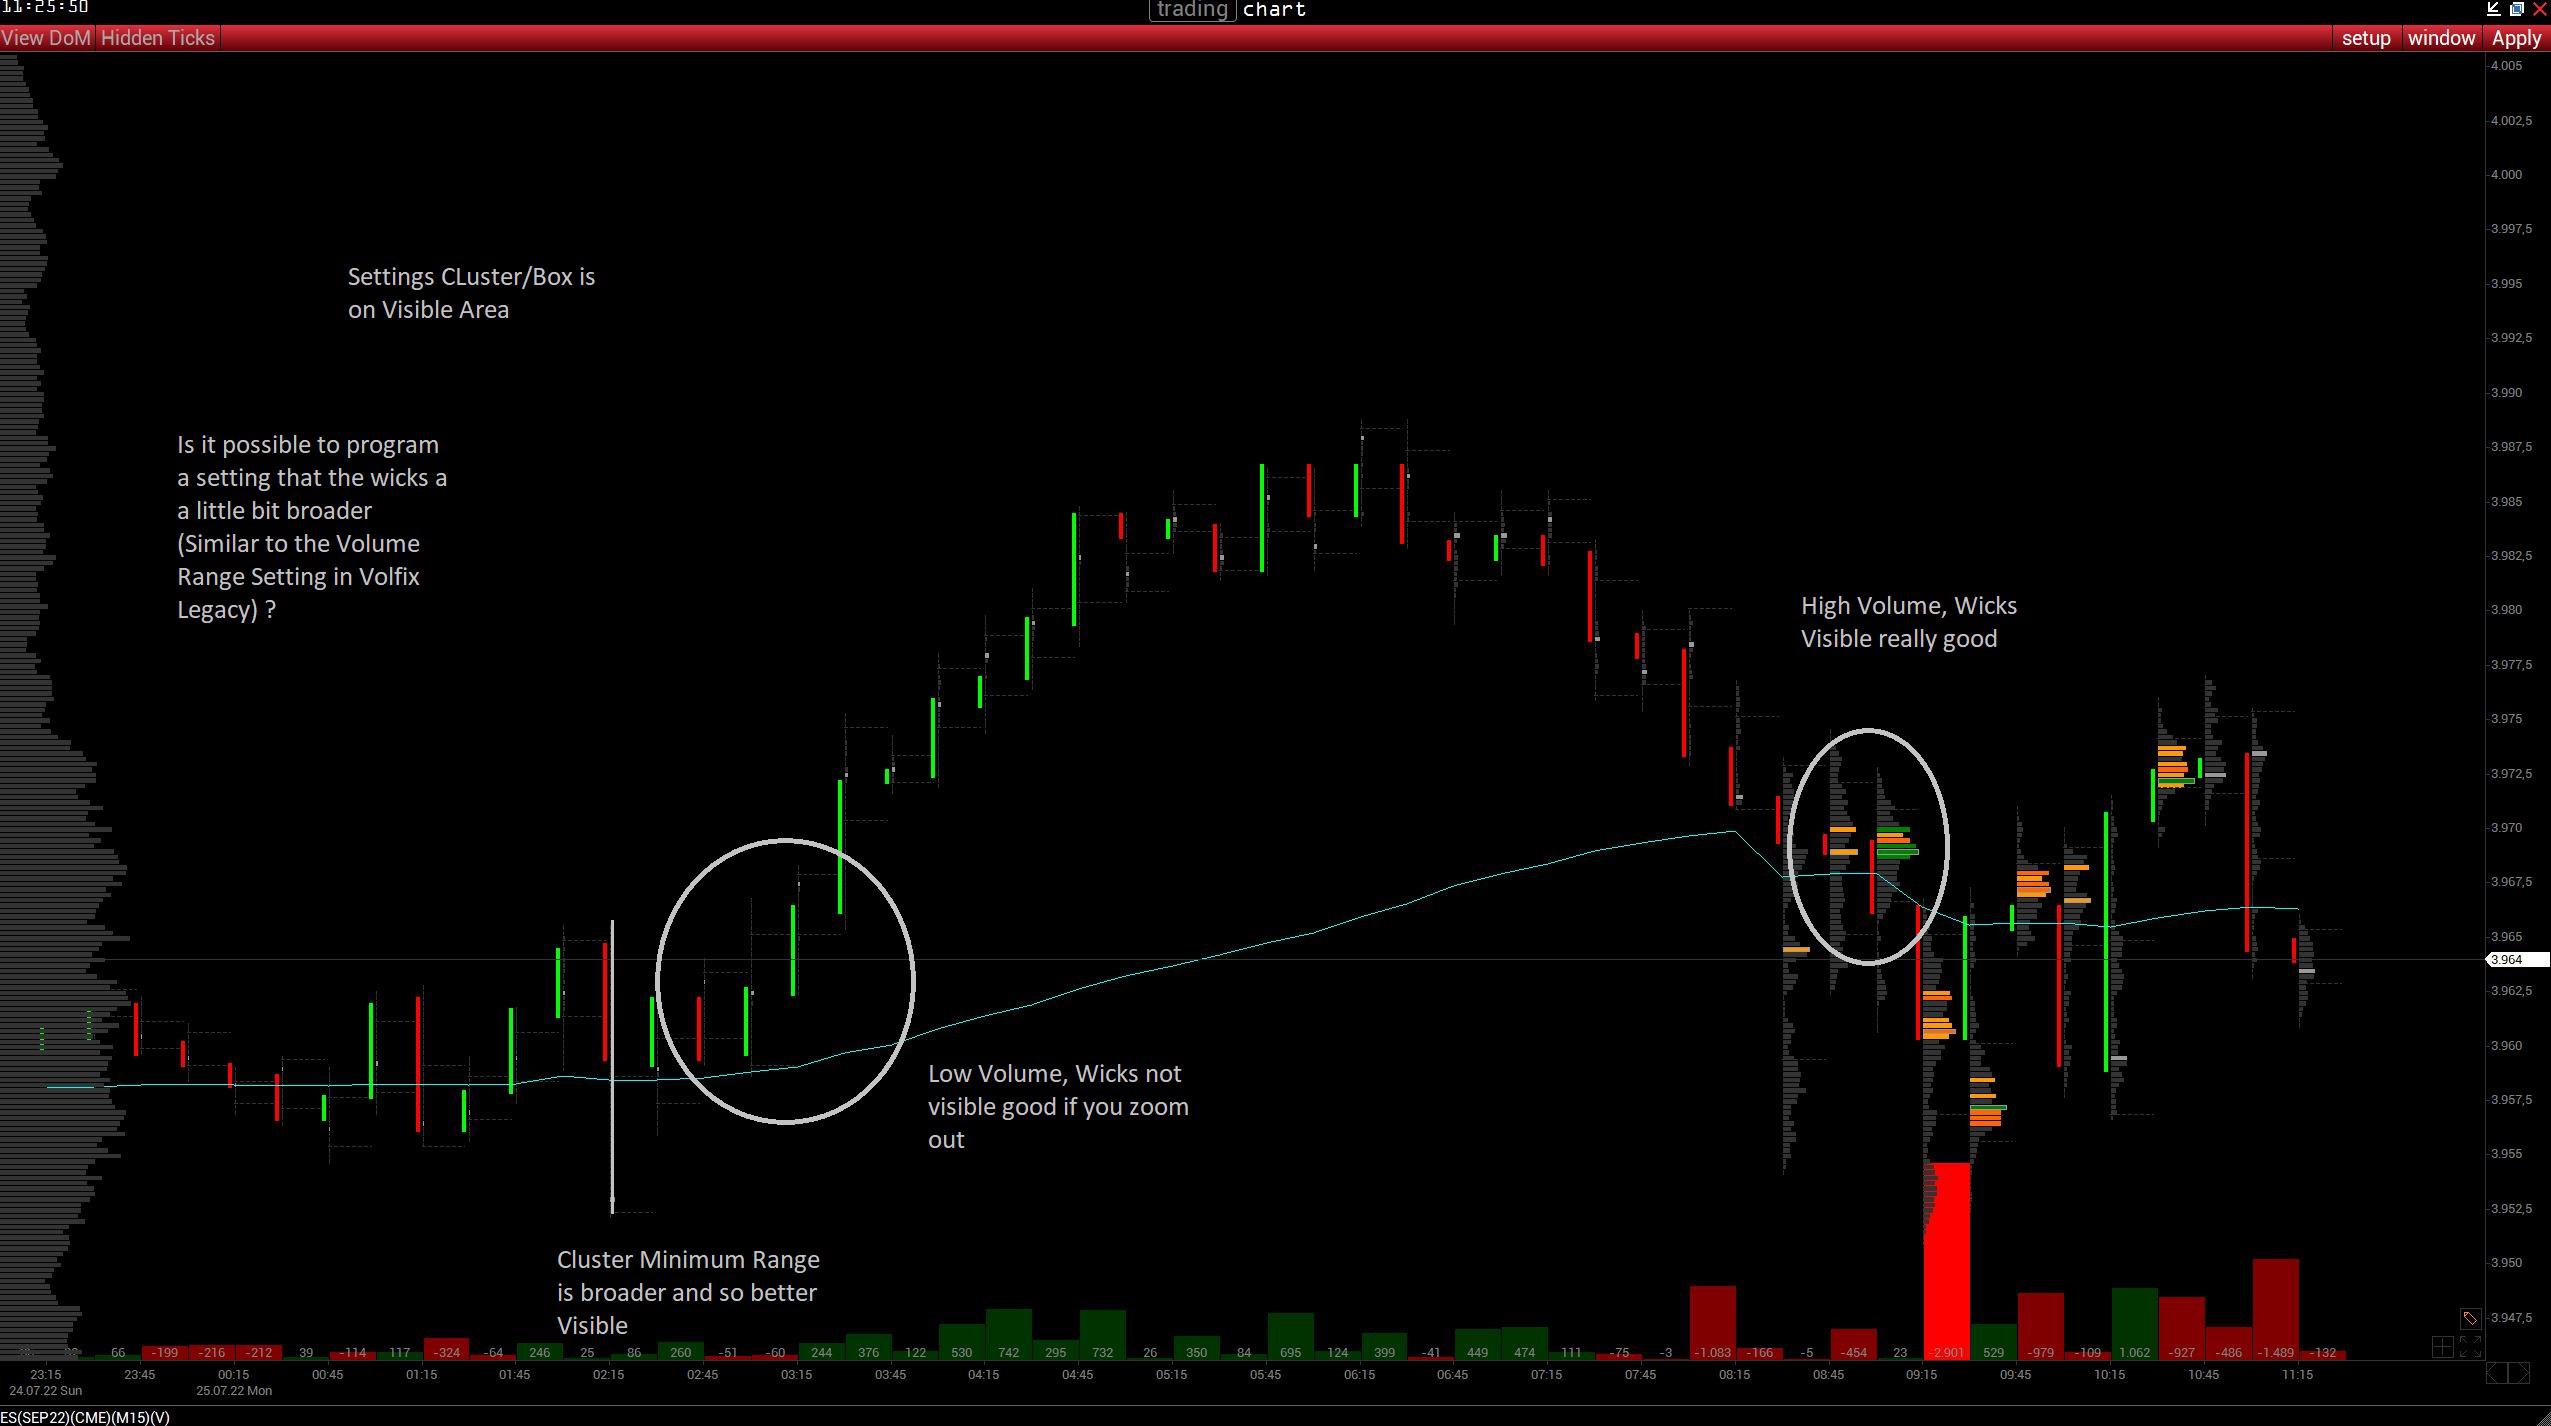
The "Wicks" in Cluster Chart are very hard to see if you have big difference in Volume Range over the whole day (Setting is set to "Scale on Visible area").
Could you please make a Setting to make the Wicks a little bit broader so that they are better visible.
(For Example a Setting where you can choose the Minimum Volume Range (like in Volfix Legacy) or an option do set the Cluster Volume Side Width broader)
Thank you
 Draw Tool Profile (P) Windows 10 - Window expands
Hello Team Volfix,
I found a strange habbit in the Windows 10 Version of Volfix (MacOS Version is working properly)
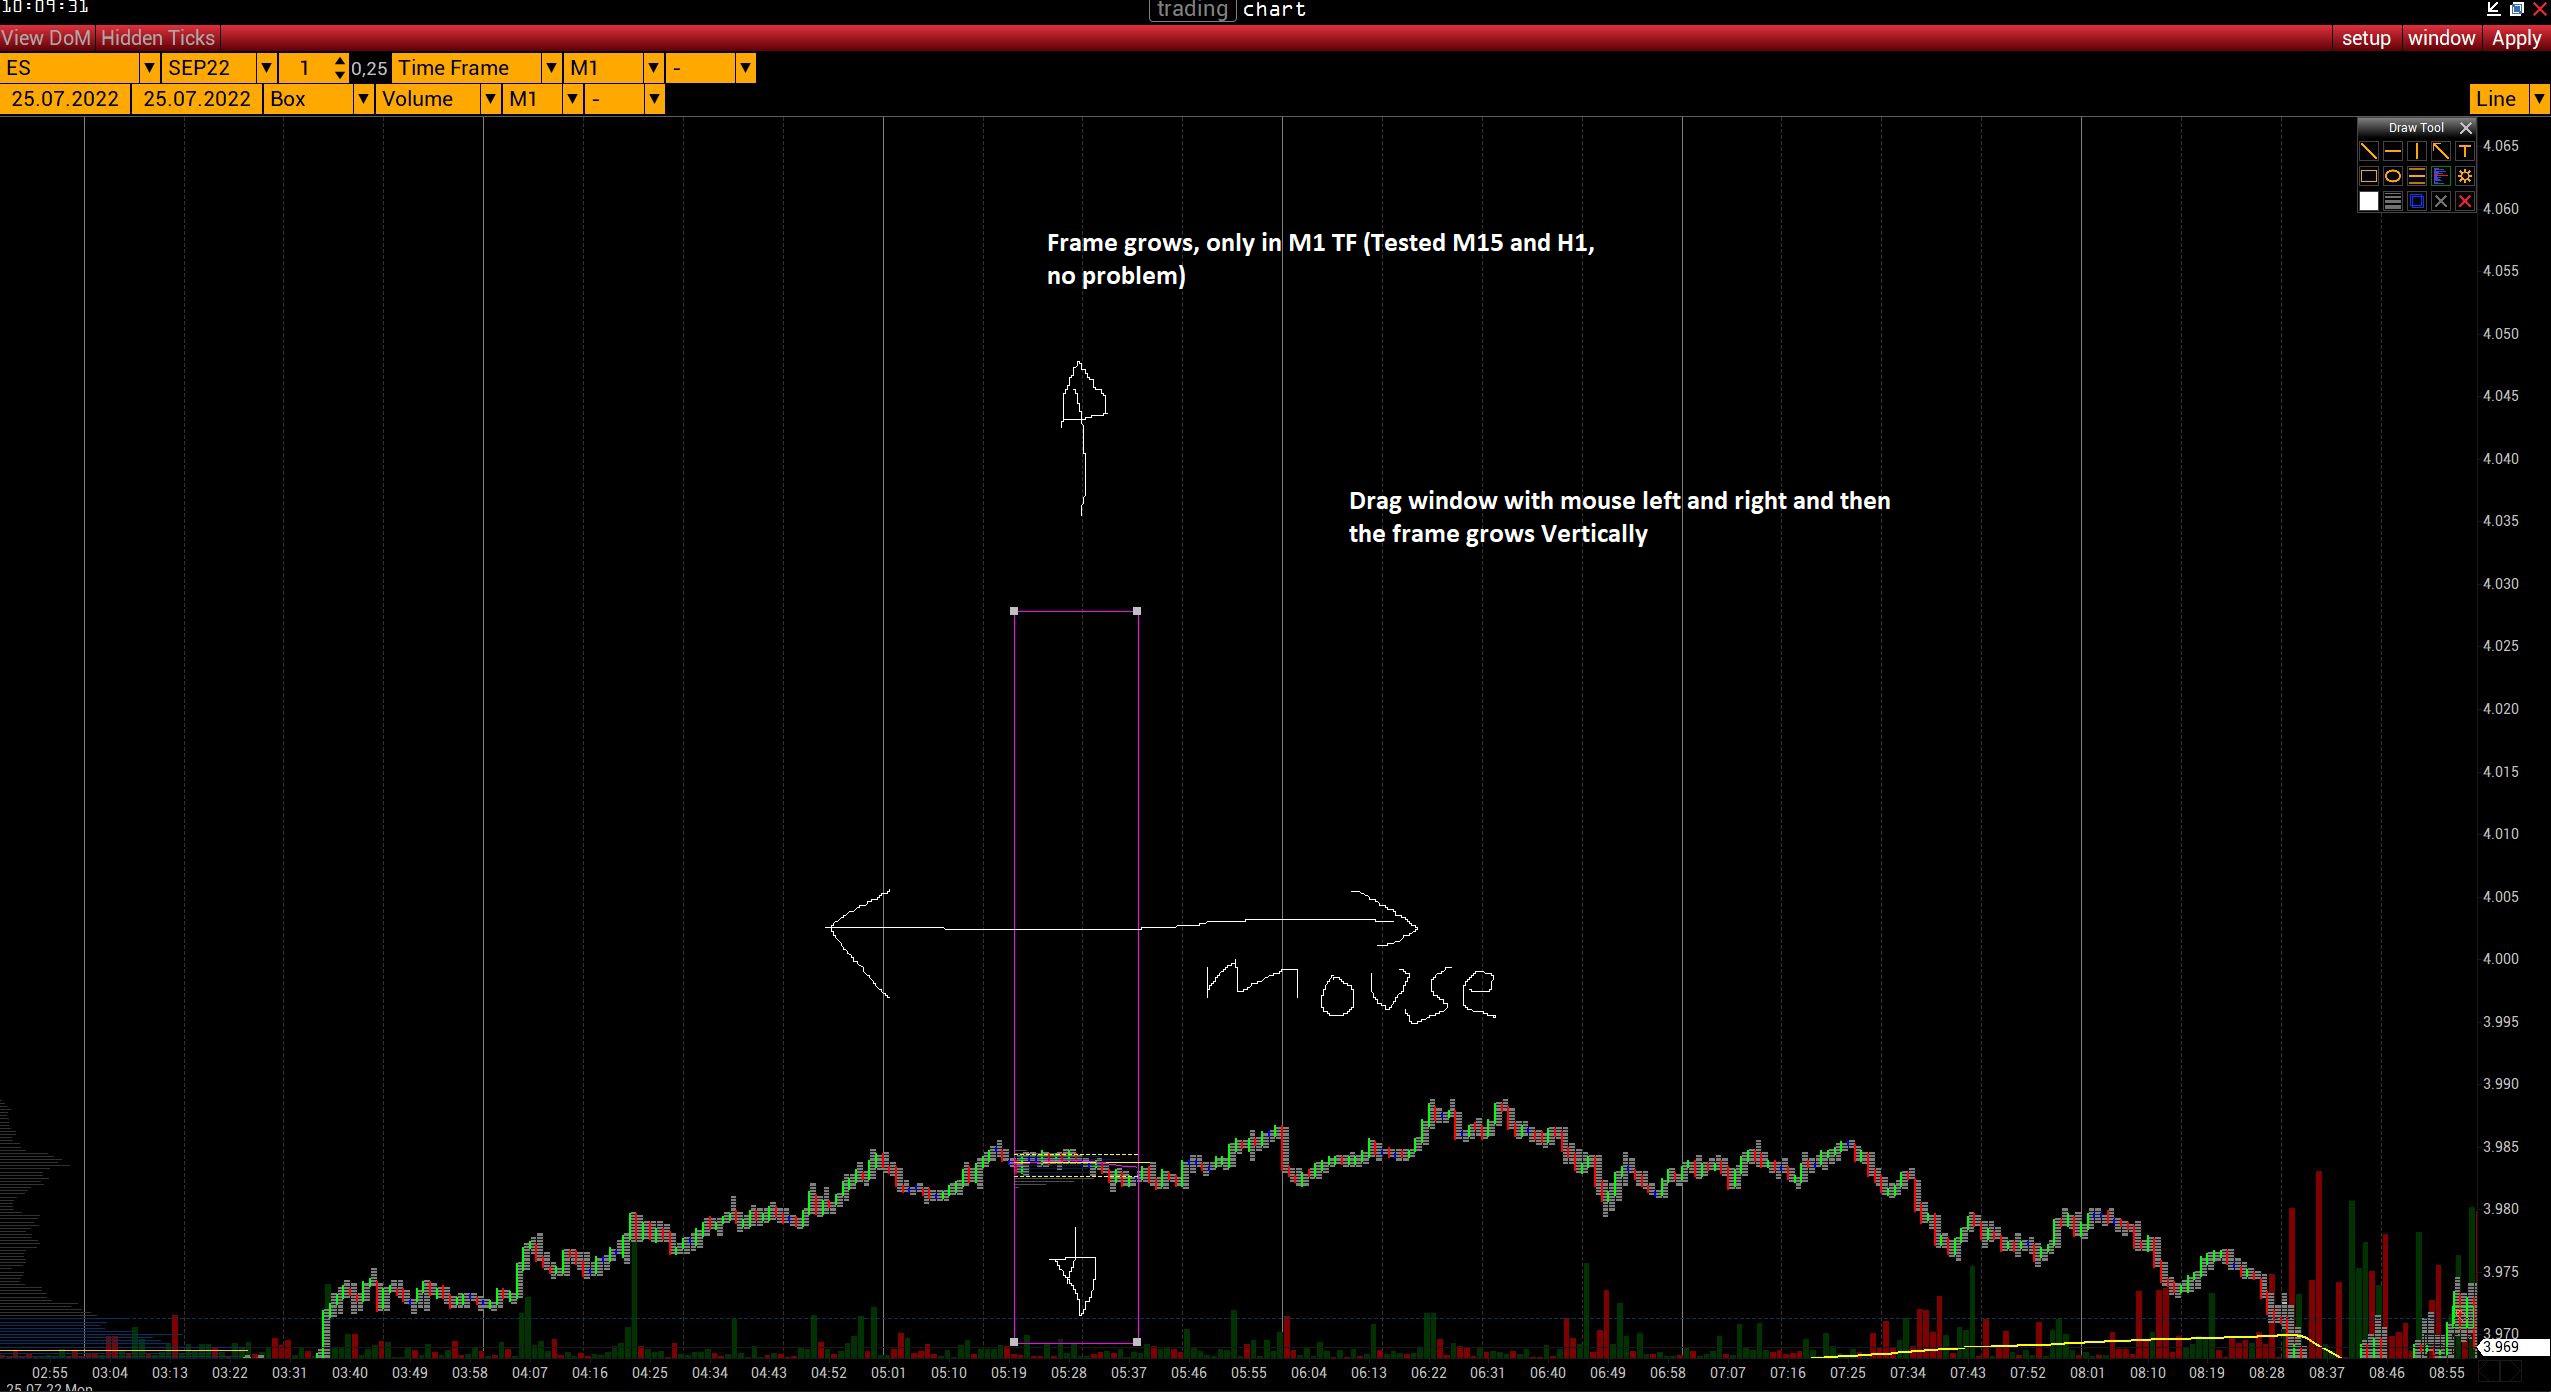
In Time Frame 1M (Cluster Profile and Boxchart) the Profile (P) Tool from Drawing Tool expands if I move my mouse horizontal (Left - Right) - The window border is getting larger and larger.
Don't know if its because of Windows 10 or a calculating Bug from the Profile Window Border
I made a screenshot for better understanding
Thank you and good work

Отображение только основной сессии в Volfixy AnyWhere
Здравствуйте!
Было бы классно если бы появилась возможность отображать данные только с основной сессии, т.е. исключая пре/пост маркет. Использование Grid вообще никак не решает эту проблема, т.к. выделяется только временной промежуток, а данные остаются в том числе и с расширенных сессий.
Спасибо!

Настройка графиков
Добрый день, просьба добавить на все ТФ возможность настройки часовых промежутков, чтобы убрать неторговые часы и настроить сжатие графиков (при сжатии пропадают выделенные лимиты, особенно на тиковом графике)
 Старая версия программы
Добрый день, в программе выскакивает сообщение что тиковый и кластерный графики будут только в версии anywhere, это означает что функционал старого волфикса будет обрезаться?
Vertical Hist. Delta - Change TF Volfix Anywhere
Hi,
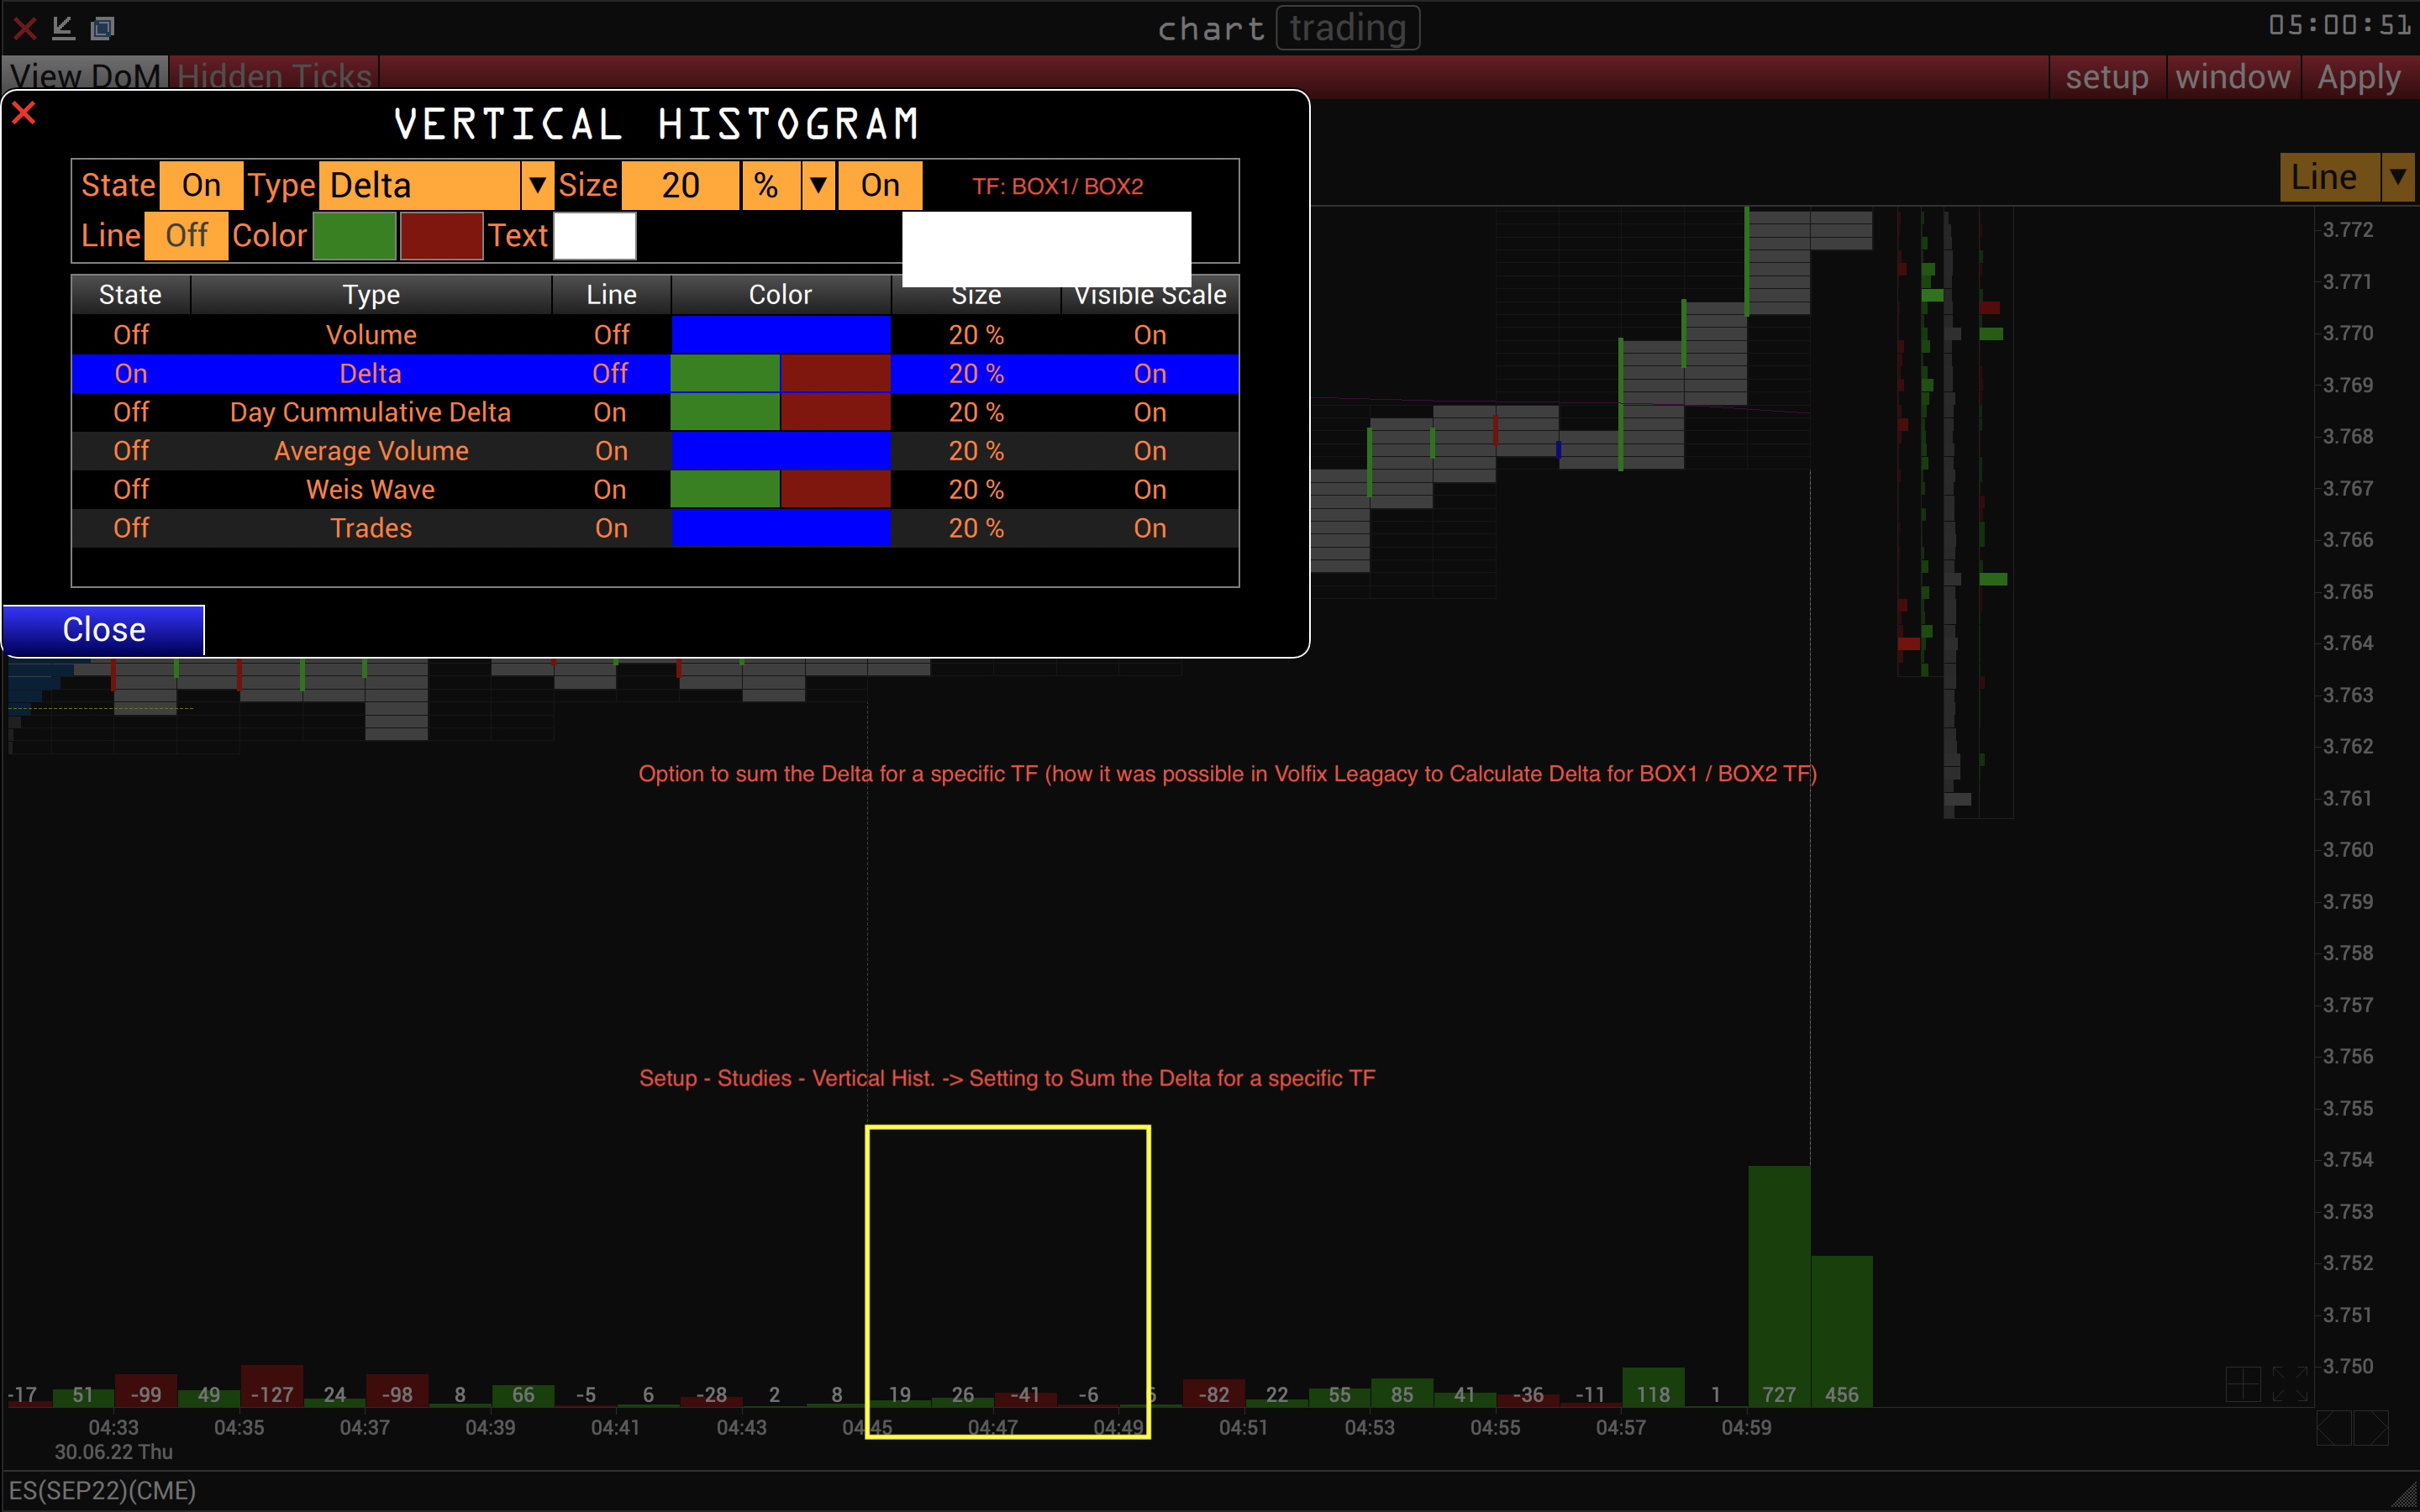
is it possible to make a setting that you can Sum the Delta in Vertical Hist for a specific TF (at the moment its calculated by the TF that im using in Boxchart - 1M , minute per minute)
it would be cool if you could make a setting to calculate the TF for BOX1/BOX2 TF so you can see the delta in for example 5 Minutes.
i made a screenshot for better understanding
Thank you
Horizontal Hist. - TPO Ray Volfix Anywhere
Hello Volfix Team,
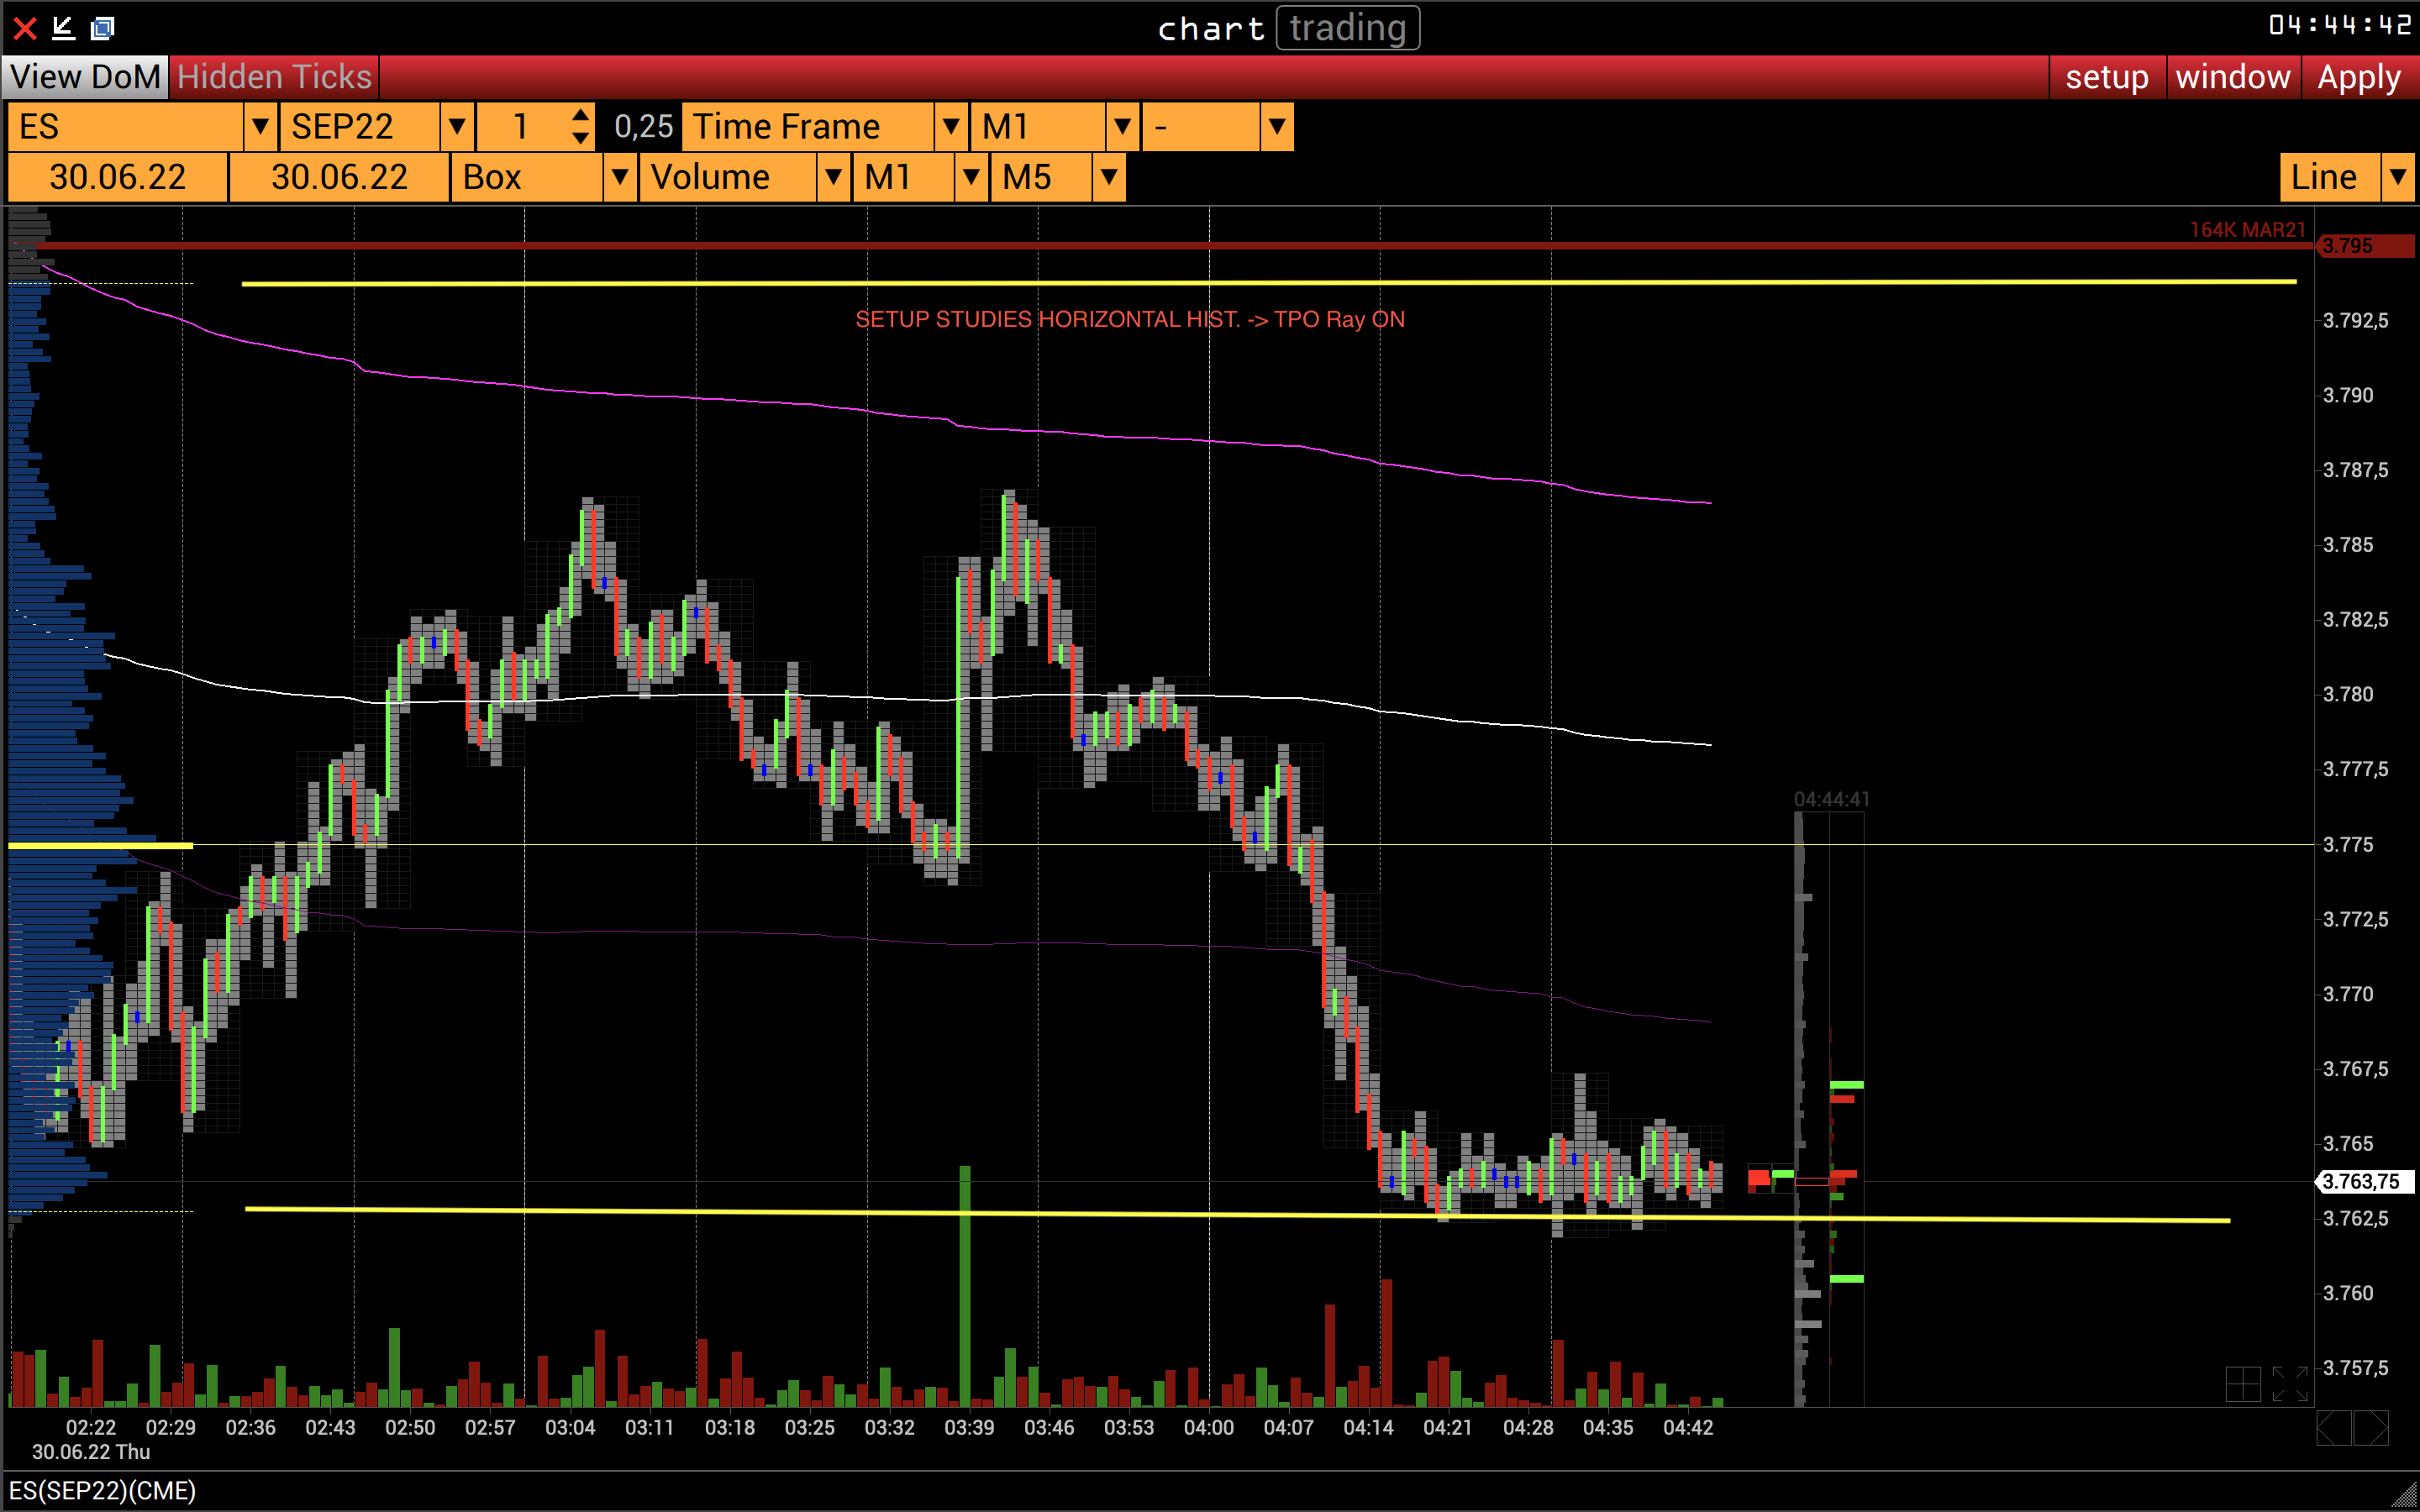
is it possible to make a Ray Line for the TPO Area.
i have made a screenshot for better understanding
thank you and good work

Customer support service by UserEcho