Welcome to the support center of VolFix

 No Bid/Ask possible (iOS)
Hello, I want to use Bid/Ask on the chart, like on my PC. Why is this simple Basic Chart not possible? Without Bid/Ask on my iPad I must take my Laptop with me.

Volfix Anywhere Theme Dark
Good Evening Team Volfix,
i recently red an article how colors are manipulating the Trades - Mind. For example the color red could unconsciously trigger fear/fight/flight reaction - for example color red is like blood and so the mind could react in danger.
I understand that the red main "Head" of Volfix is a part of its brand and style.
Could you please make a setting to change the color of the header, or a theme which is dark/neutral for the Space on top of the Cart and Menu( Grey)?
Kind regards and thank you for your perfect support
Appreciate

 Разрешение монитора
У моего монитора разрешение 2560 на 1080 и шрифт для POC очень большой и его не возможно изменить
У моего ноутбука разрешение экрана 3840 на 2160 и шрифт в кластерах очень мелкий
Есть ли или будет ли какая то адаптация для мониторов разного разрешения?

 hidden ticks volume
volfix anywhere doesn't show hidden ticks volume in the box like old version. Why? just on the spy it's show as a box
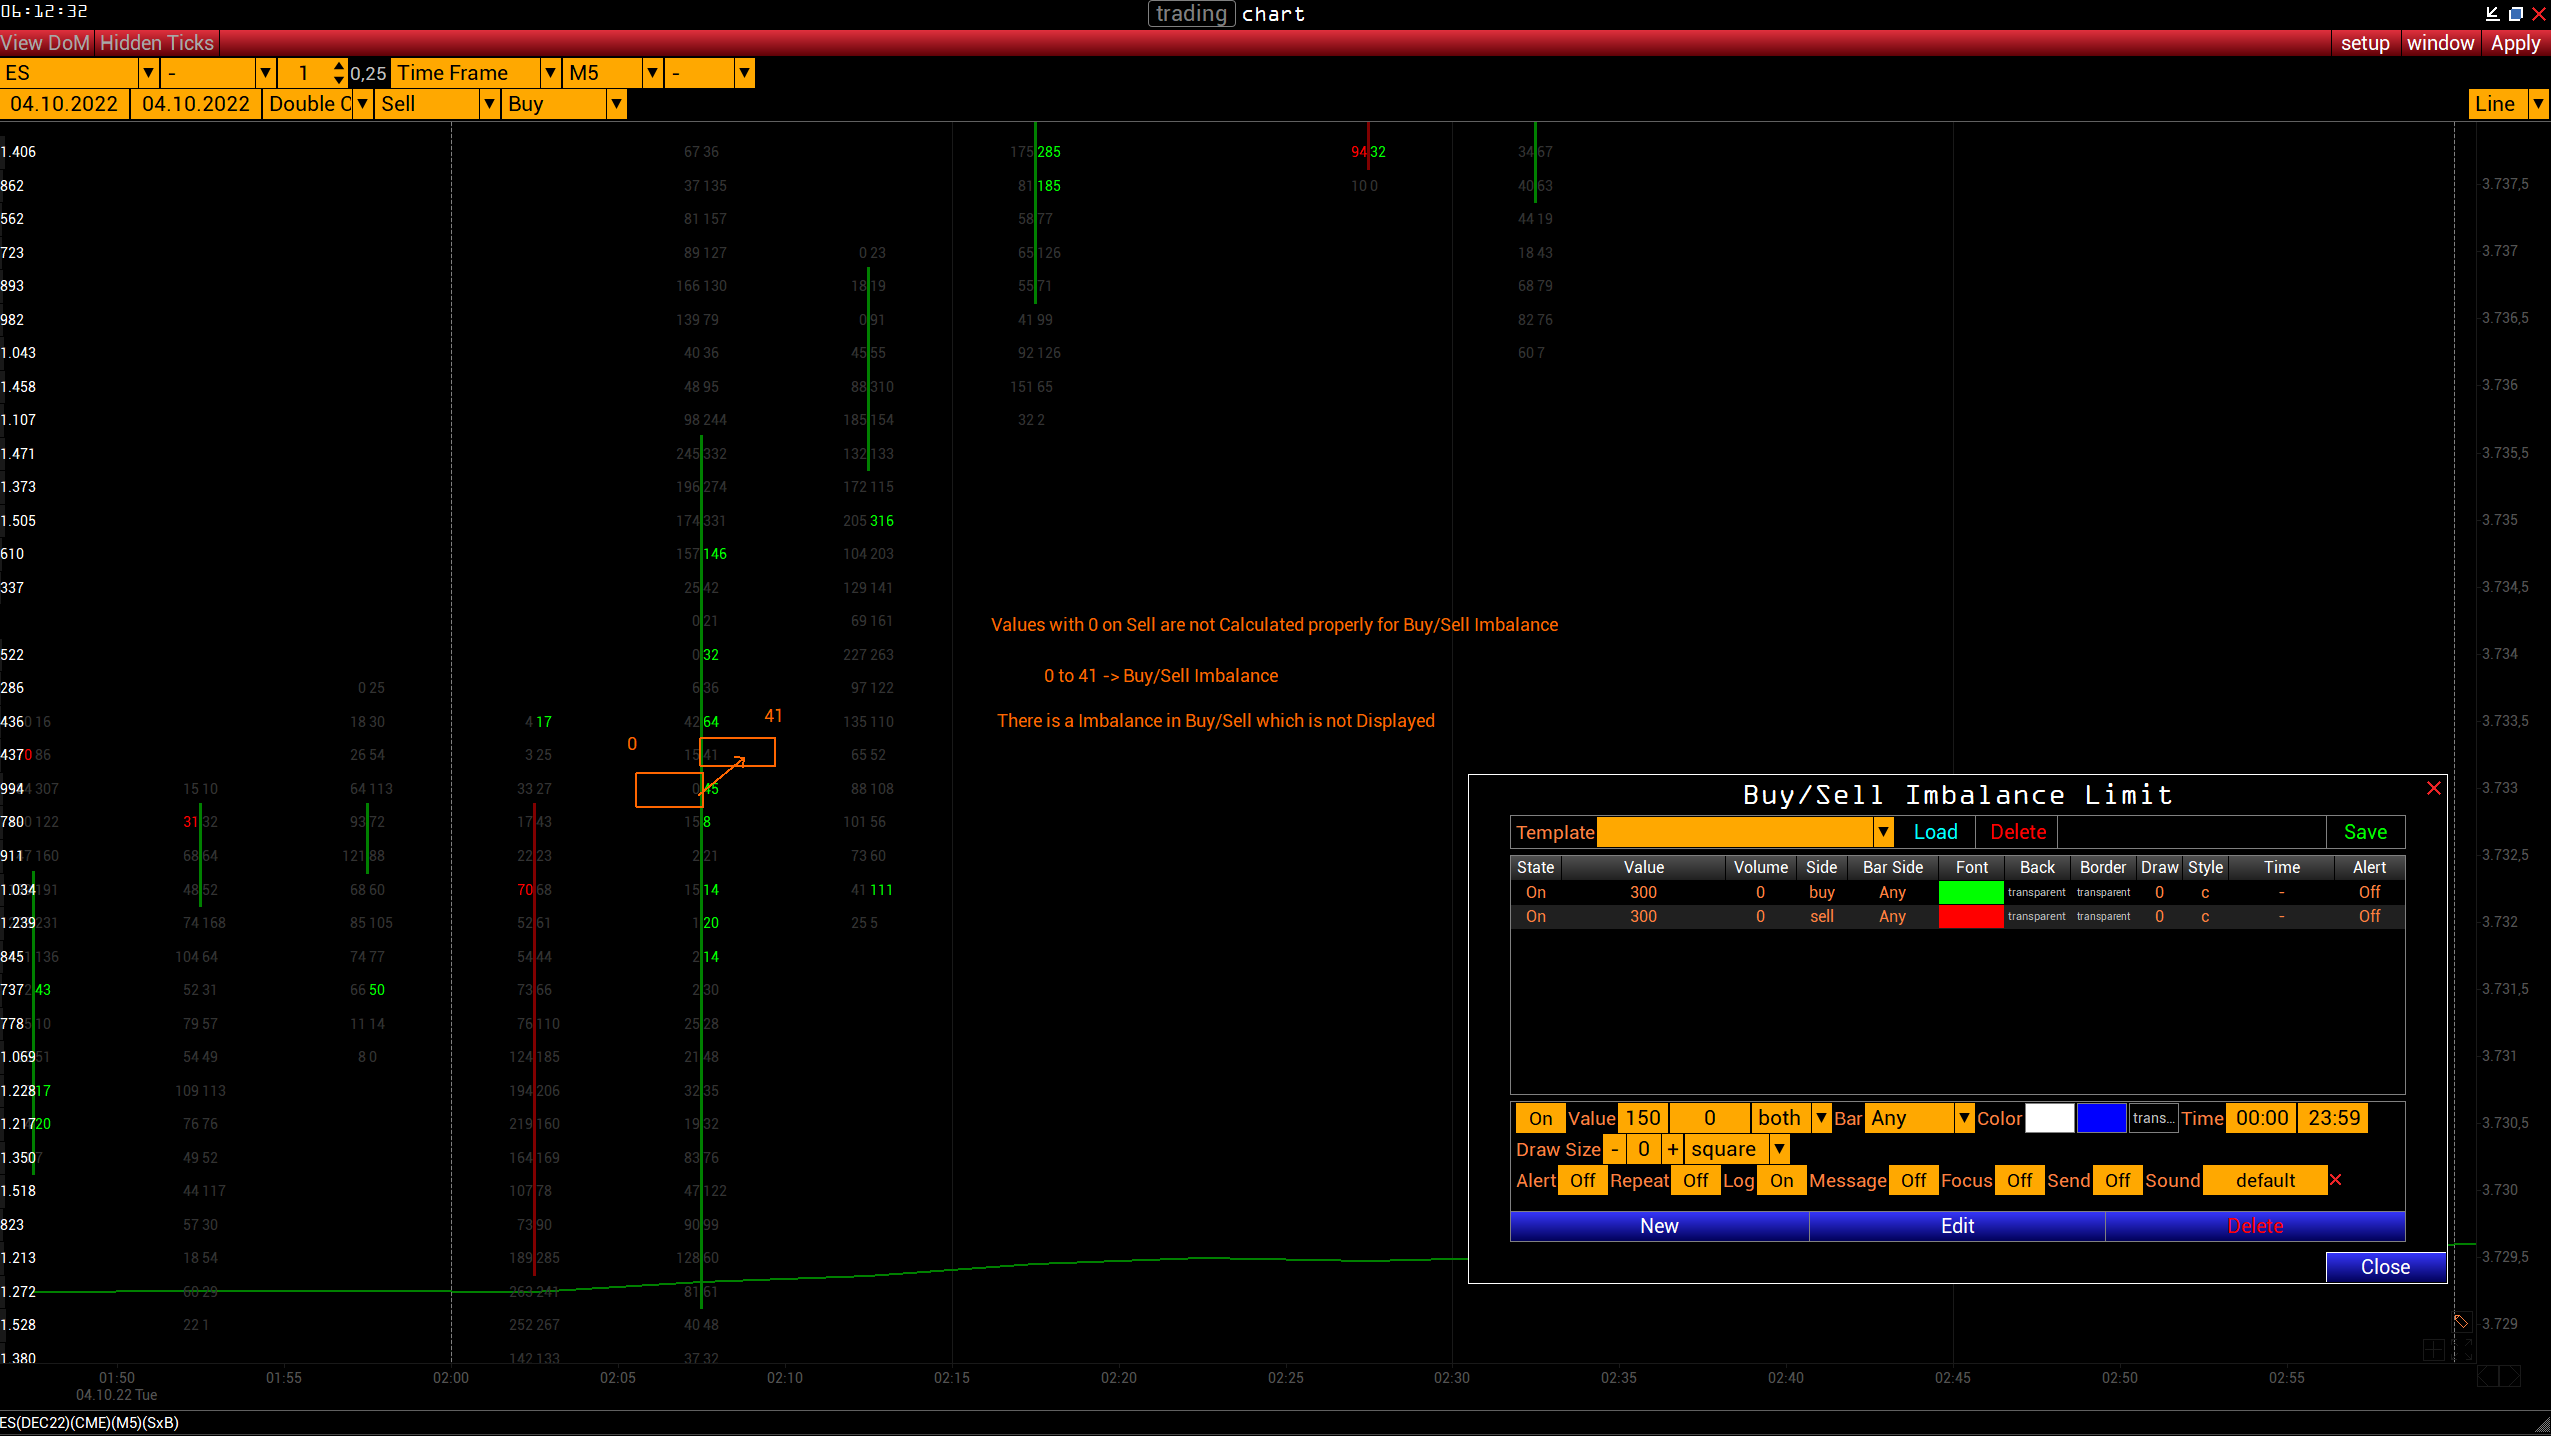
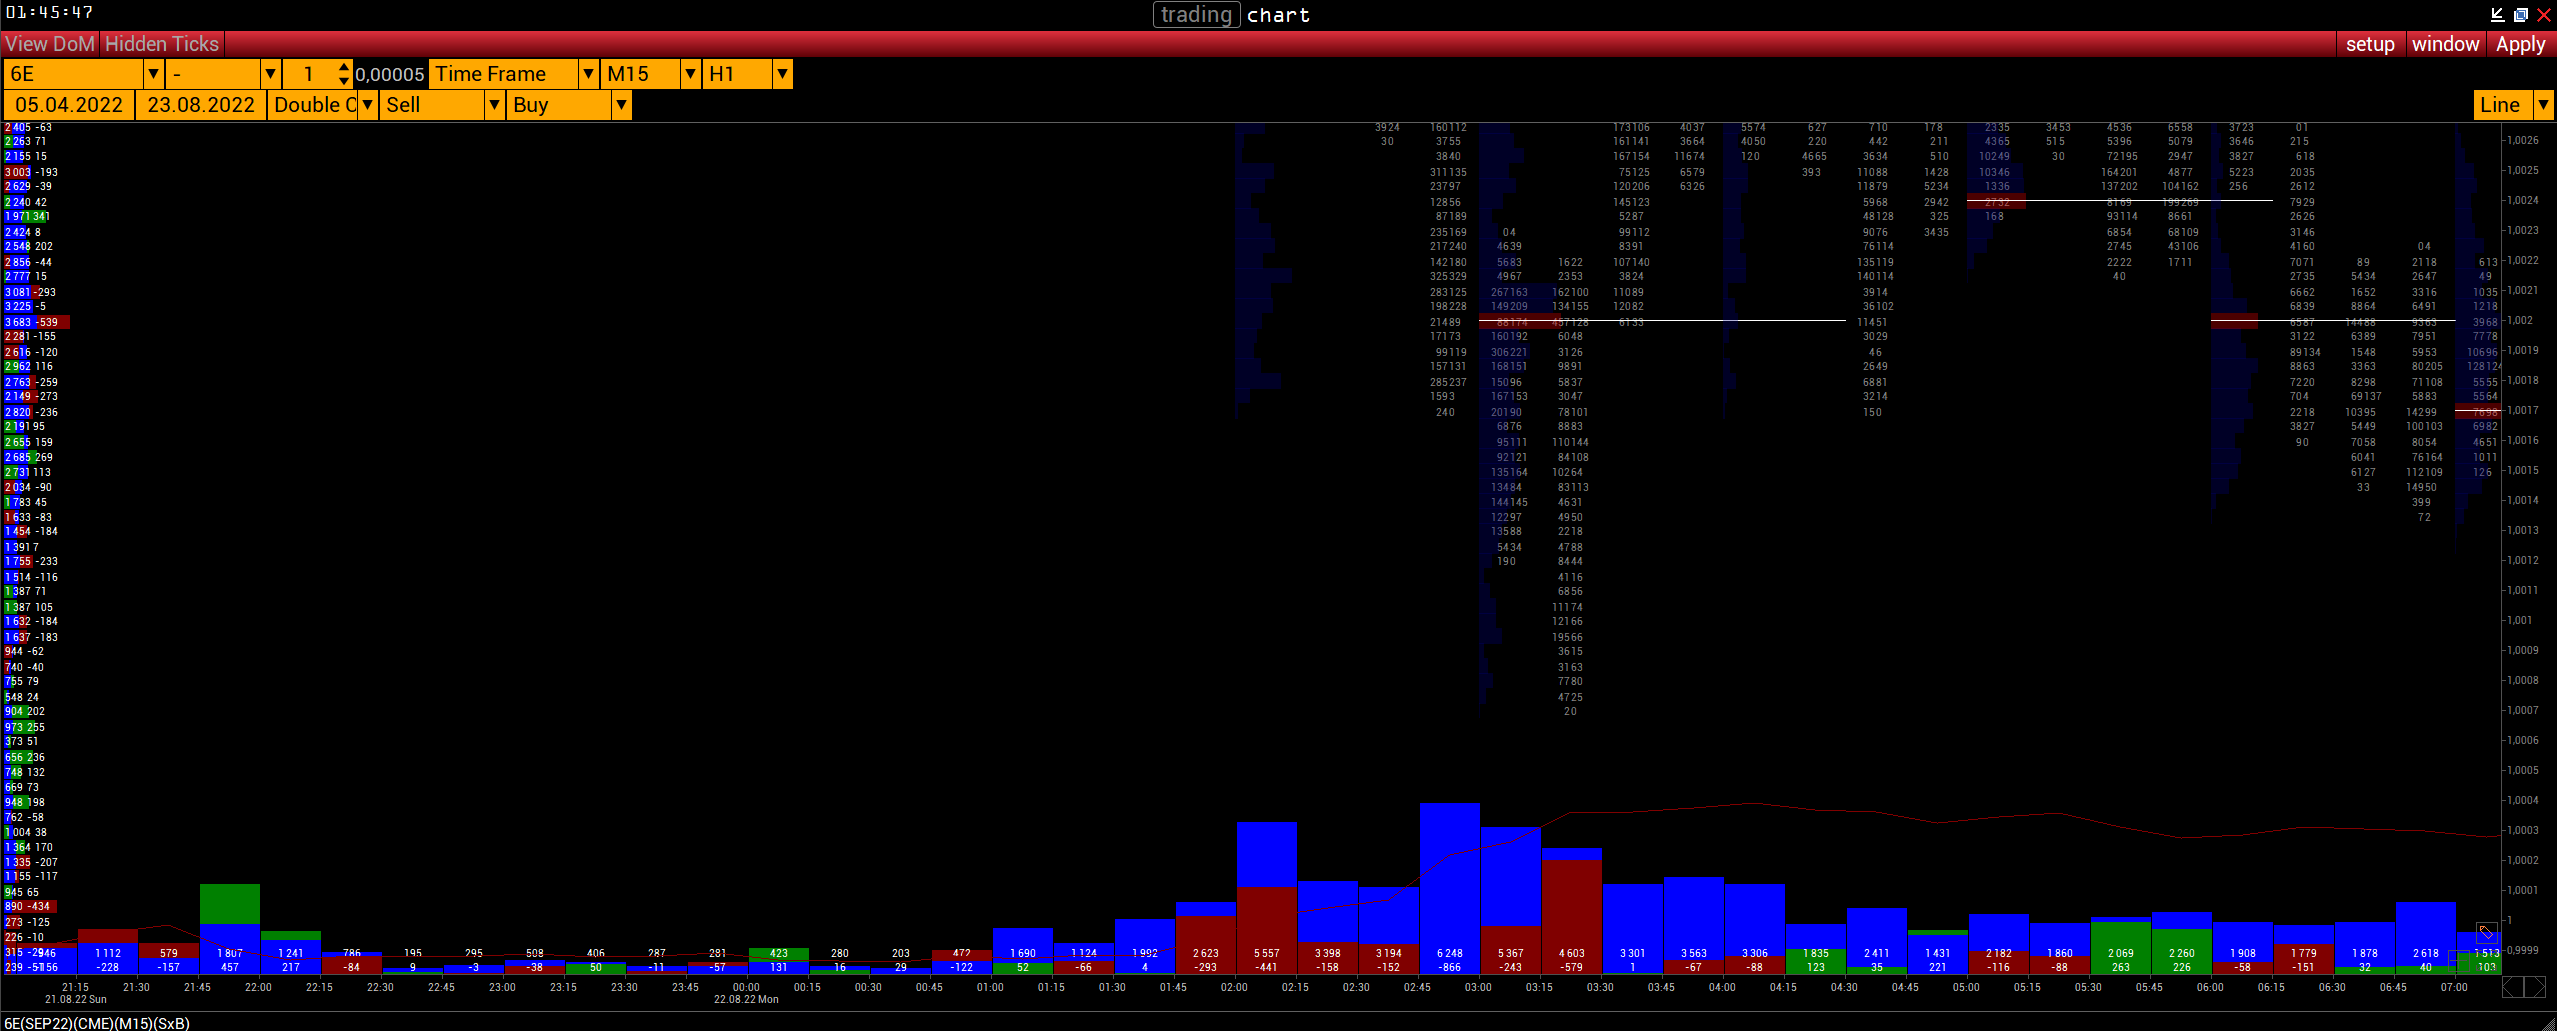
Footprint - Buy/Sell Imbalance Calculation
Good afternoon Volfix Support,
i recently saw in the footprint chart that the 0 Value on the Sell side is not calculated properly to display the Buy/Sell Imbalance. If the Value is 0 then the Imbalance Calculation is ignored.
In this example you can see that 0 on Sell side, and 41 on Buy side (Which is over 300 Value) is not marked properly.
But its important to show that aggressive market buyers are pushing in long direction.
Is it possible to include this behavior in the Buy/Sell Imbalance calculation?
Thank you and have a good an beautiful day.

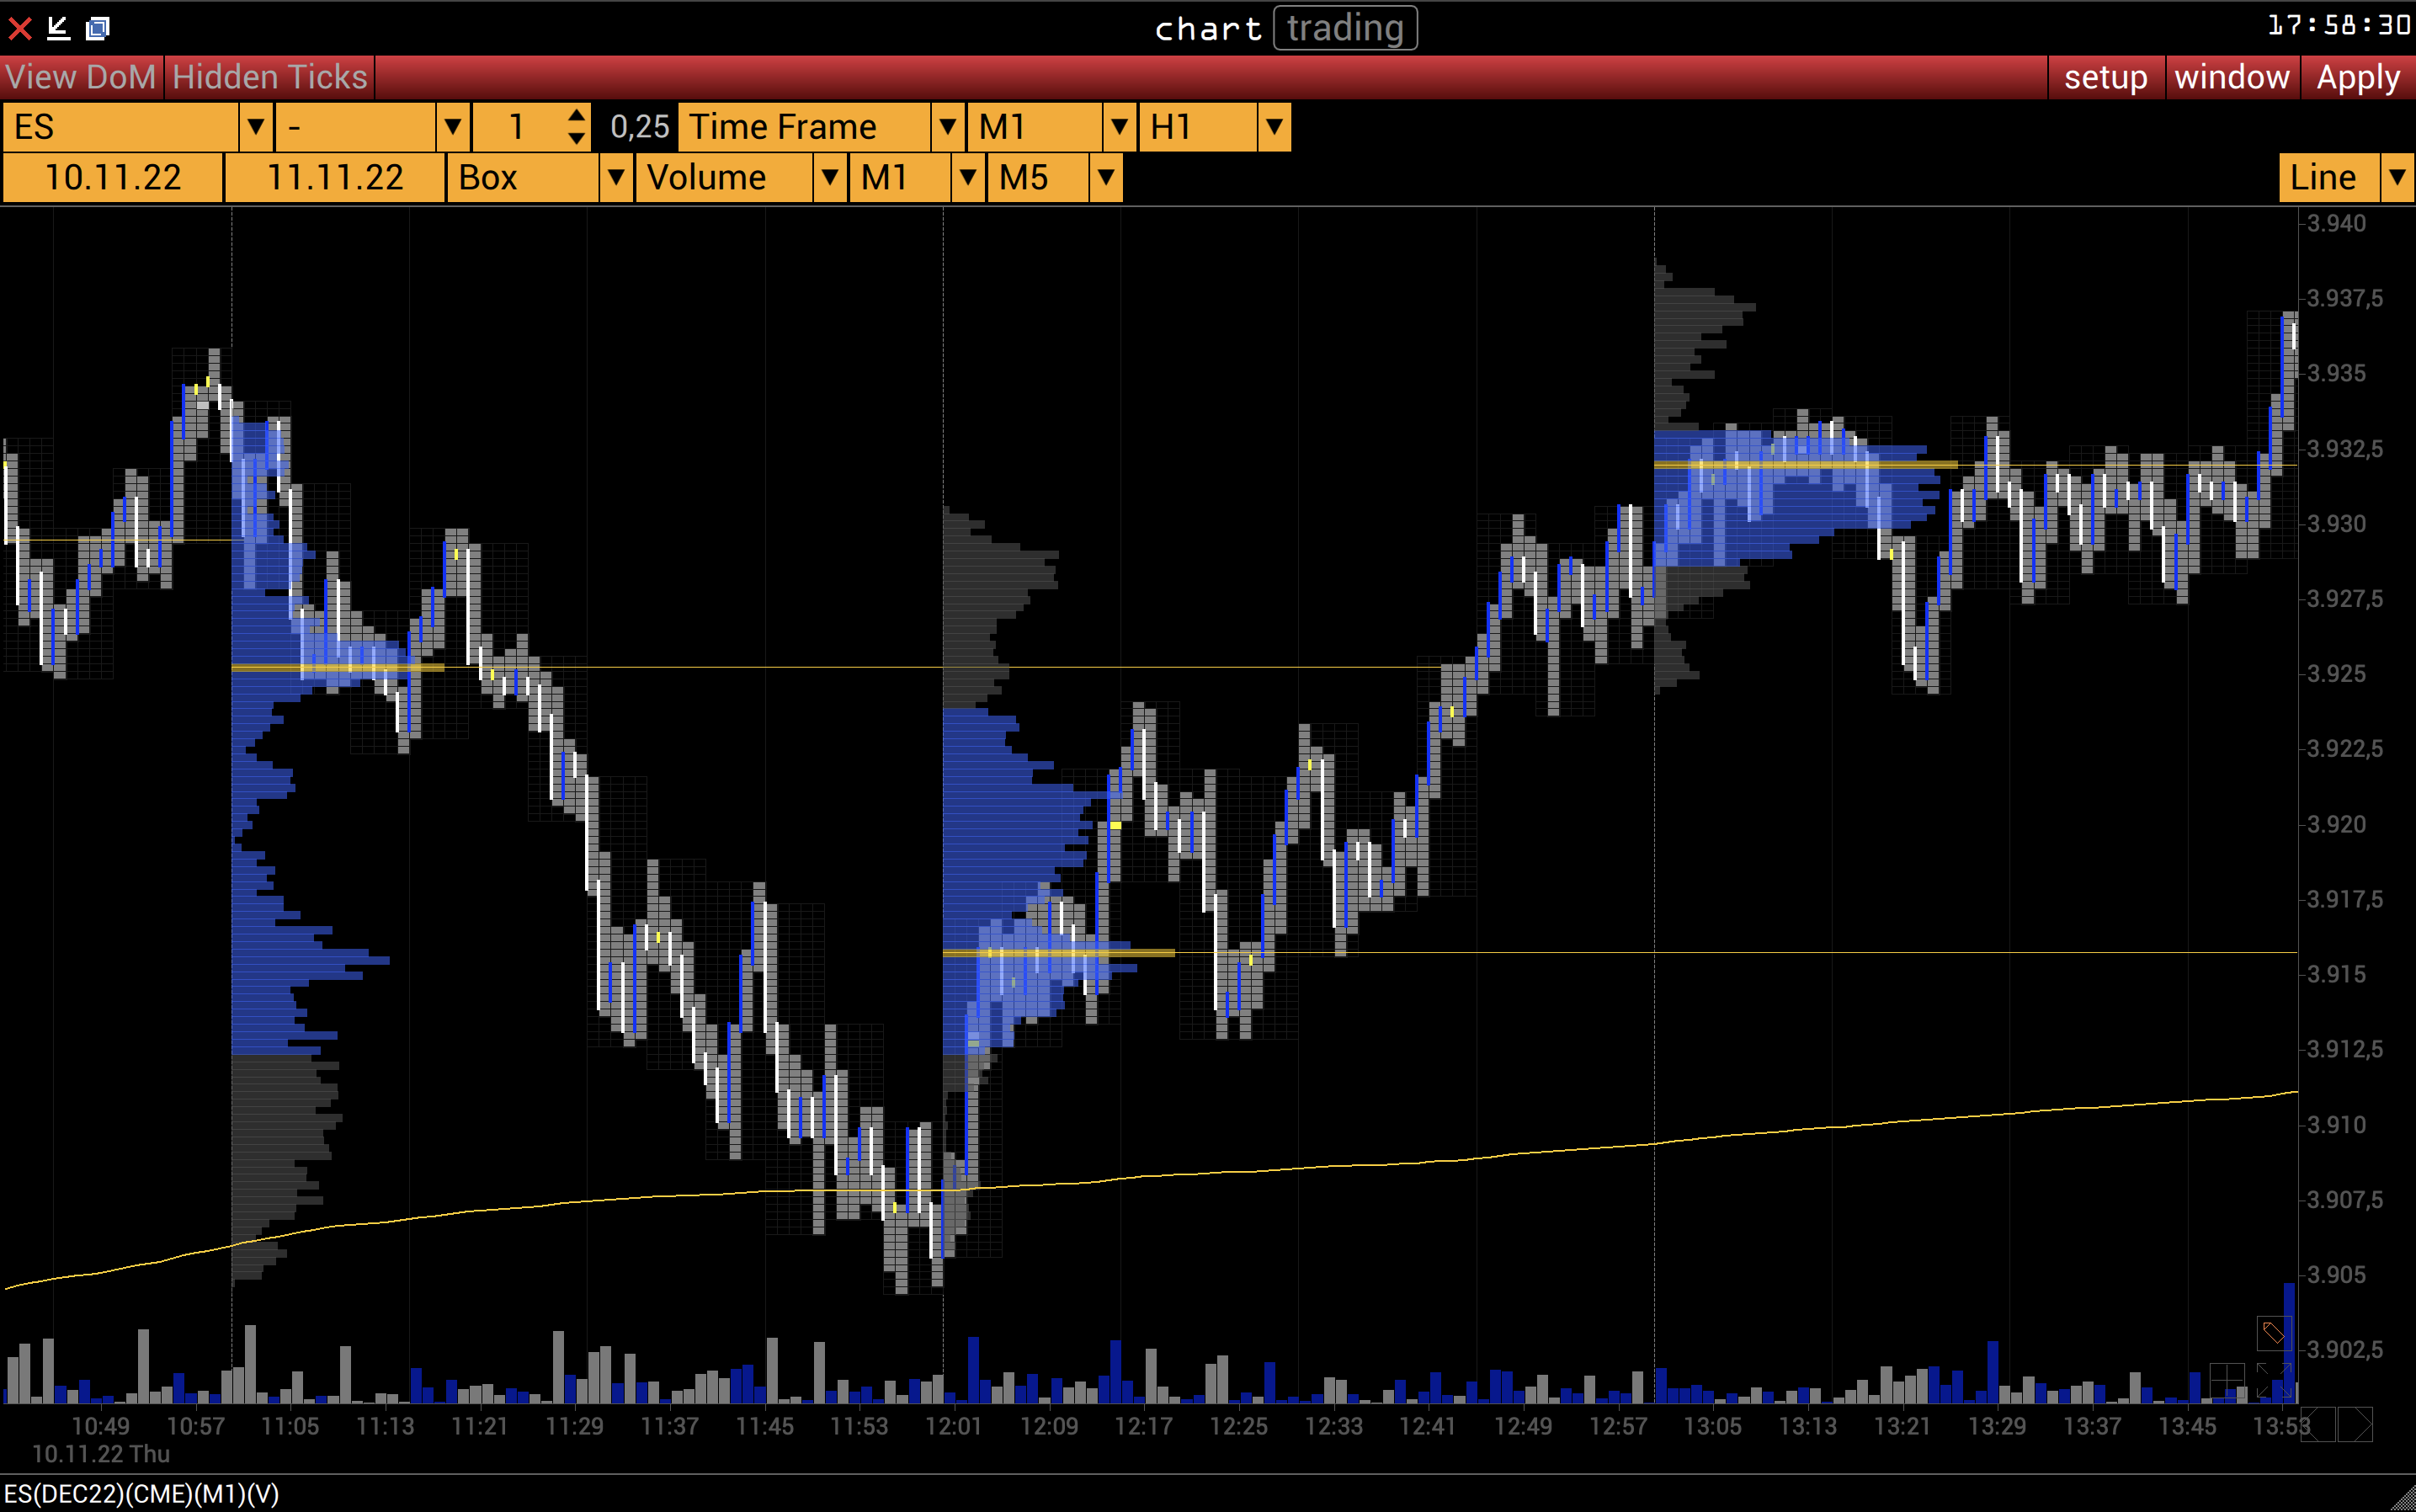
Corresponding Volume to MaxVolume-Labels
Dear Team,
I'm sure many people were very pleased that you have now provided further settings in the area of horizontal histograms with the label function. Would it be possible to display the corresponding volume in addition to the title of the maximum volume ("Today - ________", "L. Day - ________", "Week - _________," etc.)? This would add a lot of value to also find volume accumulations as a function of time.
Adding a little something, it would be very nice to also be able to display the previous day's volume of the current and last week as max volume lines.
Thank you very much for your attention.
I hope you will be interested in the comments :-)
Kind regards
B. Gröschel

alert line settings
Hi,
is there possible to change the Alarm default Alram settings ?
I need for example as default:
message off
repeat off
currently these two settings in VolFix for new alarm lines are set as: on

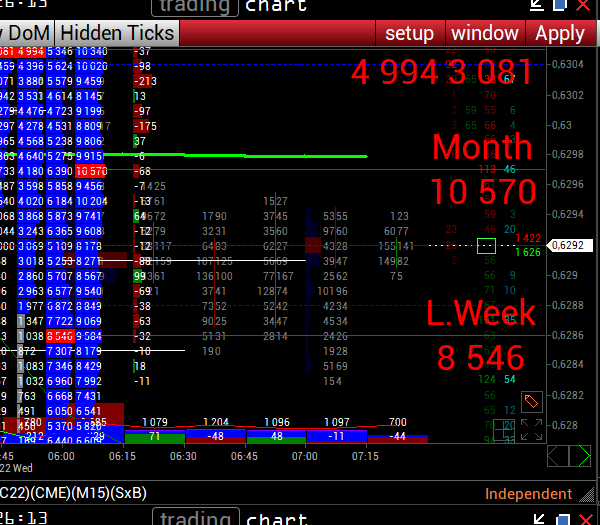
Max volume ray
В старой версии волфикс параметр max volume ray отображает уровень за прошлый период в настоящем времени. То есть линия max volume ray будет видна на текущей части графика при достижении этого уровня.
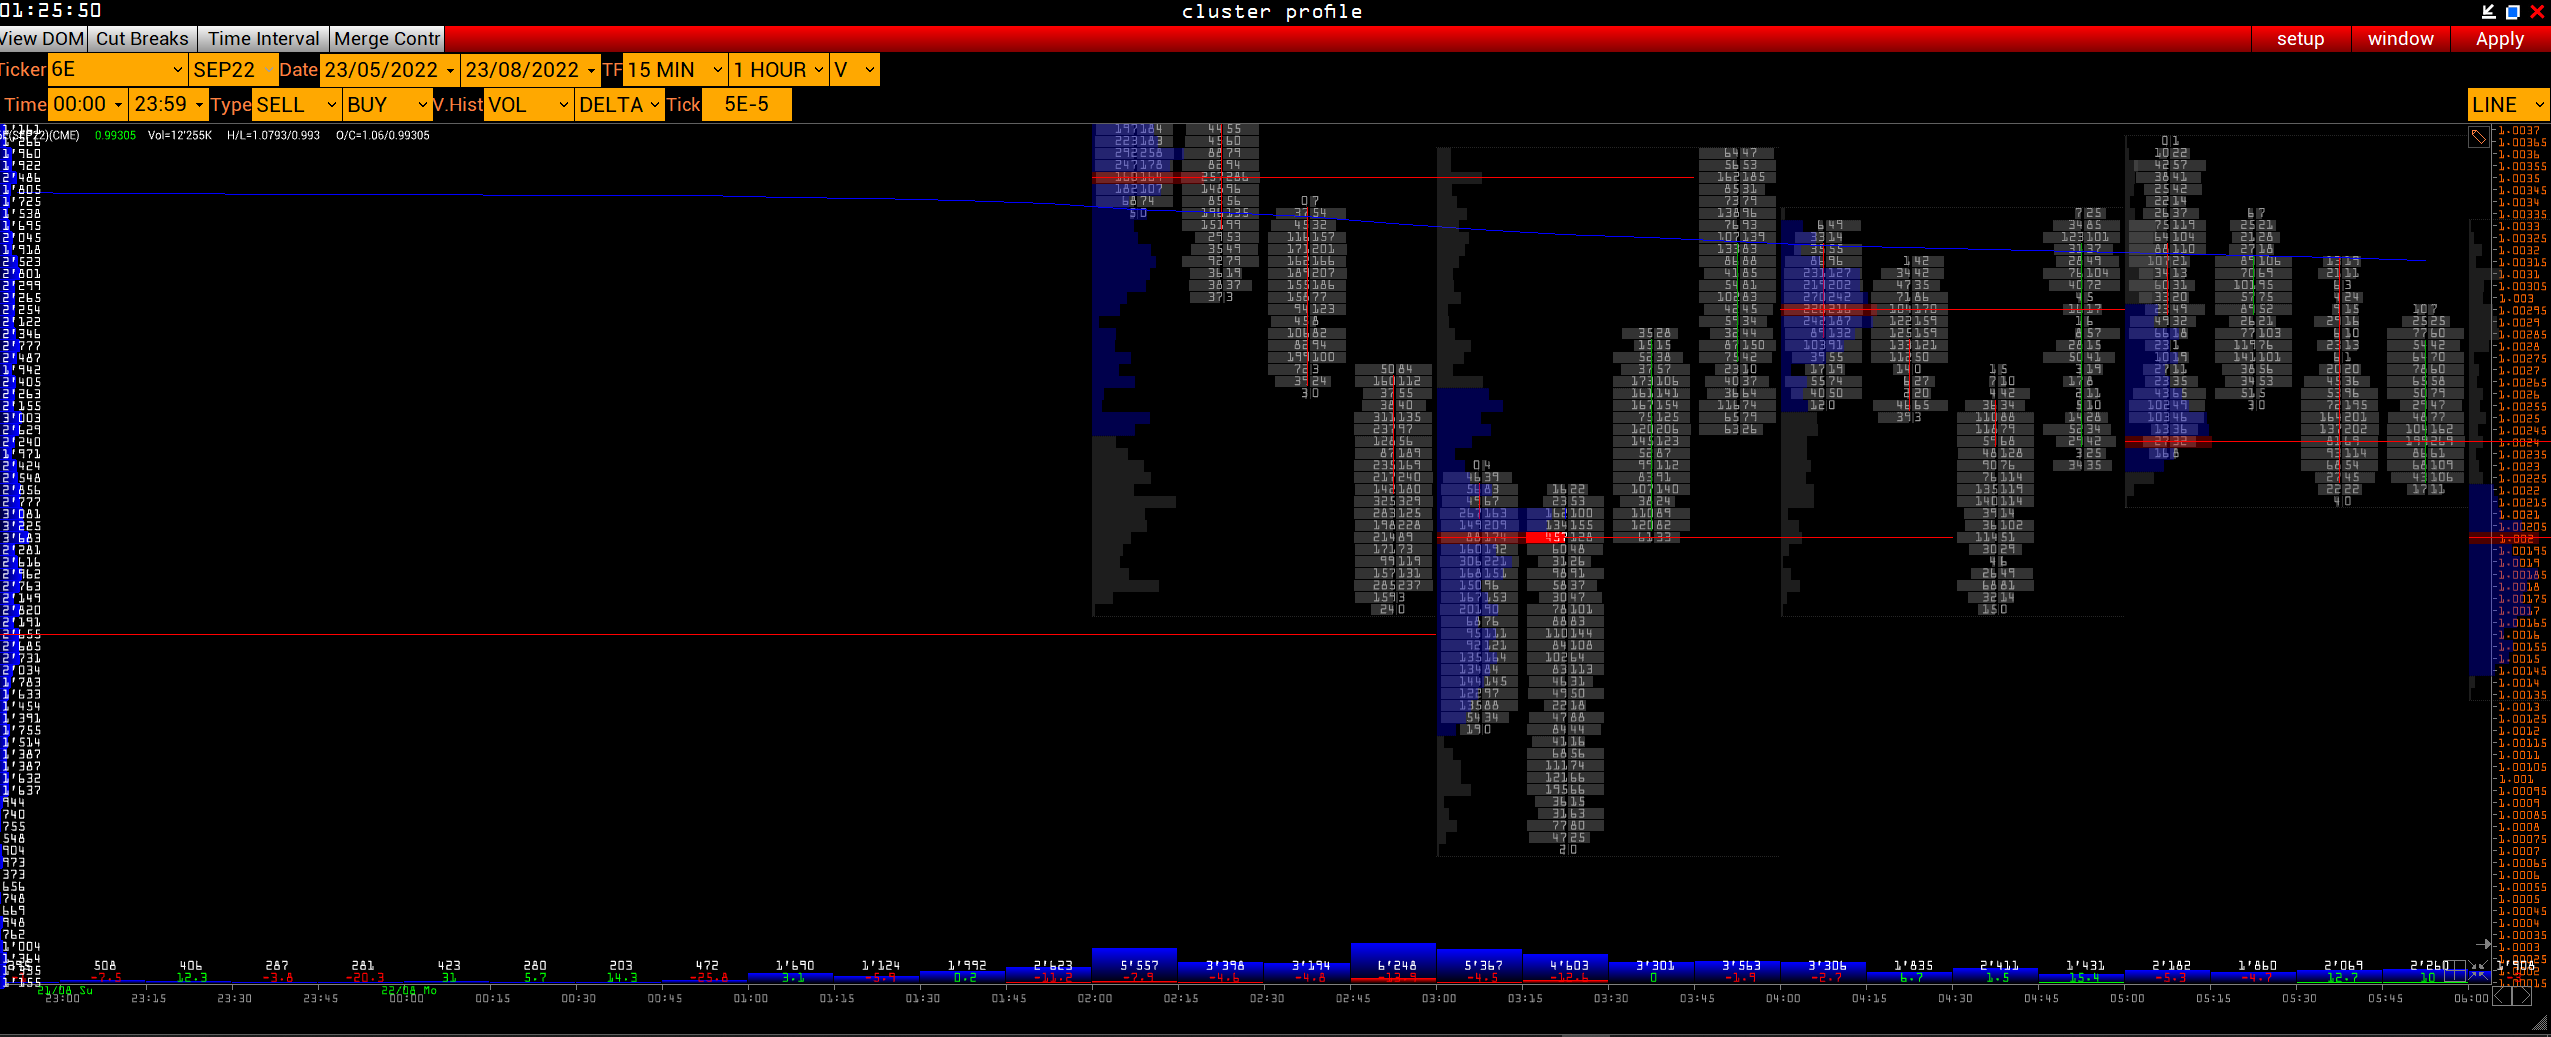
В новой версии волфикс есть такой же параметр max volume ray, только с его отображением в настоящем немного не доработано.
Для того чтоб линия max volume ray за прошлый период отобразилась на графике, график необходимо сжать.
Верните пожалуйста по возможности настройку отображения из старой версии волфикс, чтоб линия max volume ray отображалась на графике при достижении этого уровня без сжатия графика
Customer support service by UserEcho