Welcome to the support center of VolFix

 Tick bar cart - alert
Добрый день.
Не могли бы Вы добавить алерт на изменение стороны максимальной дельты в нижней гистограмме.
Спасибо.

Отличная поддержка
Приветствую!
Благодарю за оперативную поддержку.
Быстро решили вопрос. Получил рекомендации, чтобы в дальнейшем не возникало проблем с подвисанием программы в моменты пиковой нагрузки на процессор.
!! CRYPTO flow bid-ask
Добрый день.
Очень очень очень проблематично на криптовалюте визуально оценить перевес одной из сторон.
Пожалуйста, дайте сумму.

automatic volume filter
good evening everyone
which would be good to set up an automatic volume filter in the cluster profile where the correct lots are displayed which you do not always have to set by hand

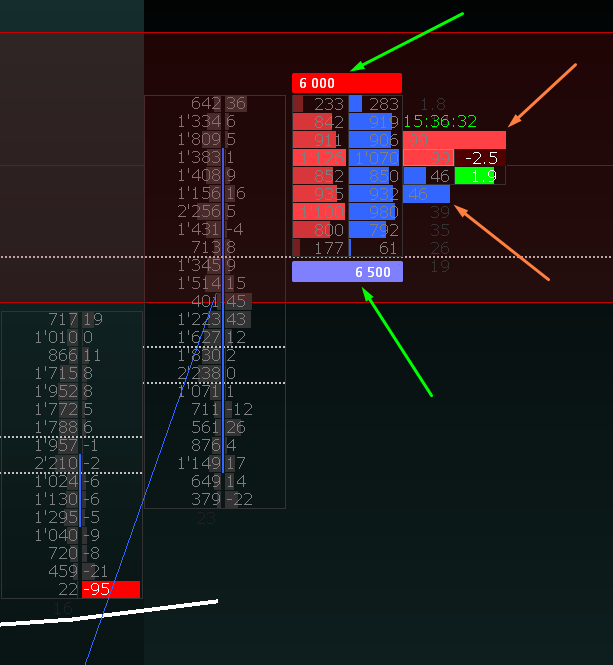
Фильтр на sell и buy
Здравствуйте.
Подскажите пожалуйста, можно ли реализовать такую идею? Фильтр на sell и buy, выставленный в кластере, чтобы подсвечивалась только та сторона кластера, которая проторгована большая по объёму. К примеру, на sell и buy подсвечиваются оба фильтра на объёме 100 контрактов, но, объективно победил тот, у которого больше проторгованных контрактов, и чтобы тогда не подсвечивался тот, у которого меньше проторгованных контрактов.

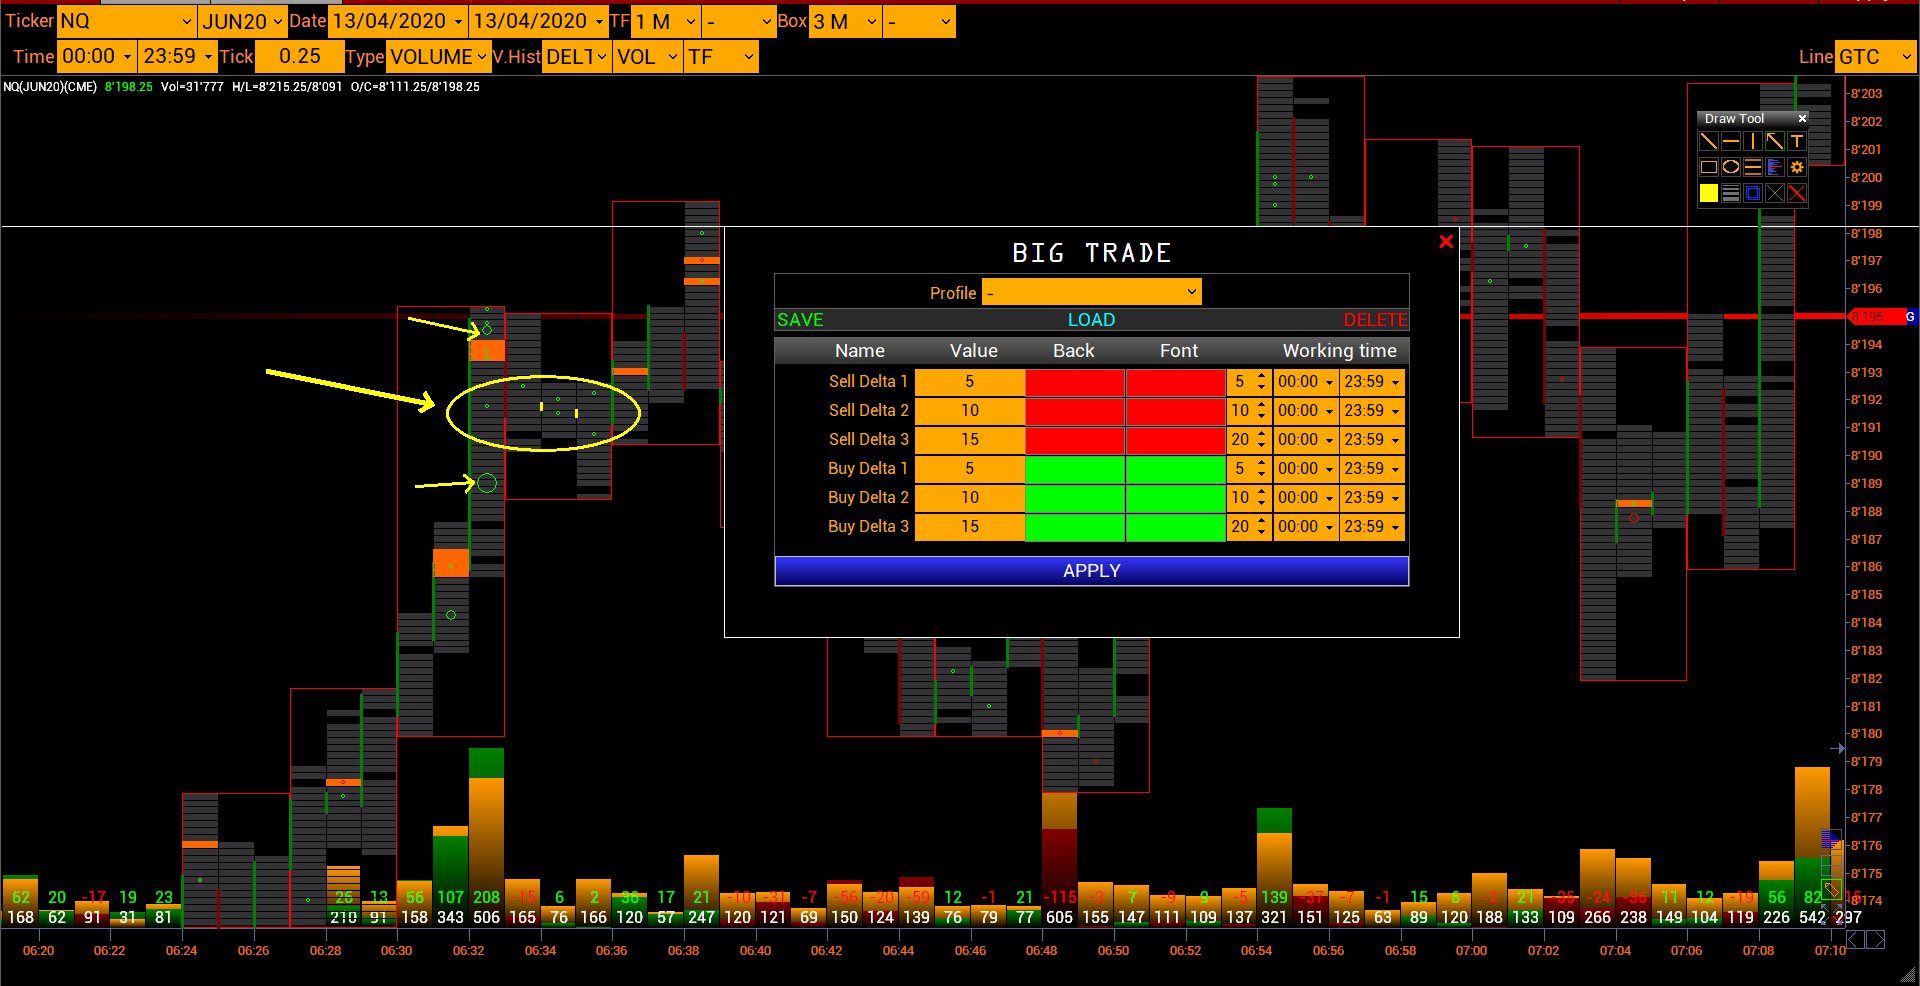
big trade
good morning I noticed that the big trade function is very useful but following the indications on the size of the circles I noticed that using the sizes (5,10, 20) you could lose them graphically if I do not enlarge the graph but I want to see a wider view , perhaps an idea, if these circles were better identifiable or could also use a larger size of 20 hypotheses up to 30 or 40 I could better identify certain important trades thanks

Кто придумал сделать дизайн в стиле MSDOS?
Кто делал дизайн вашей платформы? Настроек нет, горячих клавиш на позиции нет, цветовая схема - хоть глаз выколи. Кто вообще придумал сделать дизайн в стиле MSDOS?
Я даже не понимаю почему Open и Close бара горит одним цветом, все перерыл и так не понял как сделать нормальные бары.
У вас дизайнеры вообще не в курсе что ПИСАТЬ ВСЕ ЗАГЛАВНЫМИ В ПЛАТФОРМЕ И БЕЗ РАЗДЕЛИТЕЛЕЙ НЕ ПРАВИЛЬНО.
Во всем цивилизованном мире давно придумали окна и кто вообще поставил этот "цвет детской неожиданности" во все что только можно.
Может быть с исполнением ордеров у вас все и в норме, но дизайн платформы просто СТРАХ БОЖИЙ!!!!
УВОЛЬТЕ СВОЕГО ДИЗАЙНЕРА И НАЙДИТЕ НОРМАЛЬНОГО.
Платформа - ДЕРЕВО, абсолютно не настраивается для пользователя.
А окна, управление окнами, вы что разработчики, думаете что это для людей удобно вообще?
Внешний вид платформы нужно полностью менять она вообще не пригодна не для анализа не для торговли.
acceleration
hello i would like to set up the platform to get an indication of the acceleration of the volume by tick is there a way to do it? or otherwise it would be nice to have an acceleration indicator directly on the graph that I show the volume acceleration phases in a simple visual way thanks to the help
Volume profiles - on the right
hello, could you add the possibility to set profiles on the left or on thet right?
example of profiles on the right:
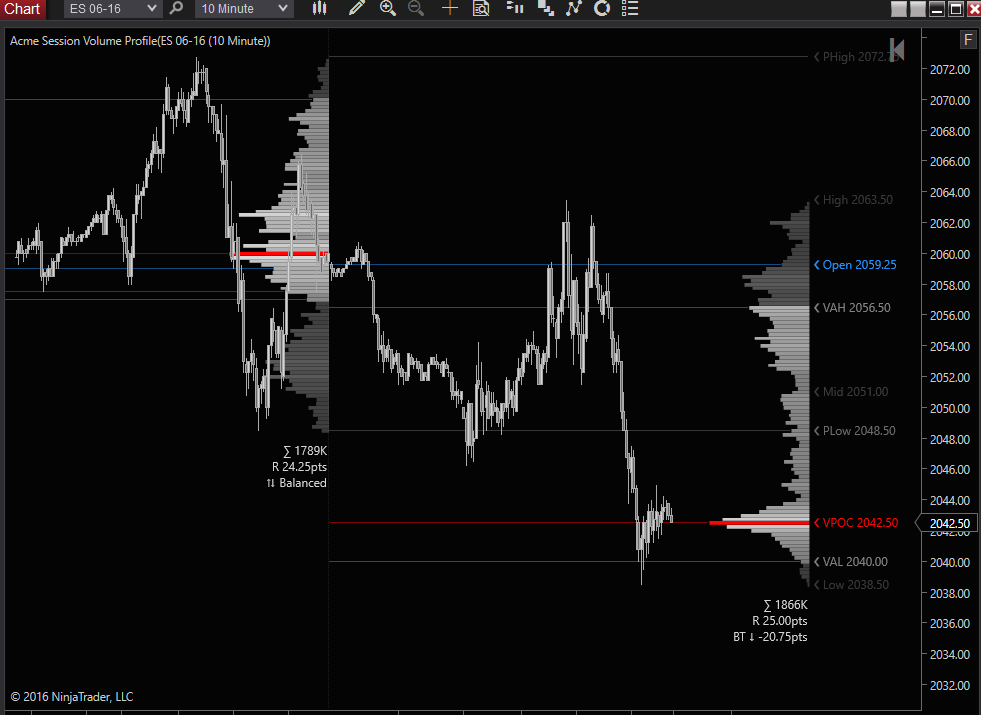
mayby here:
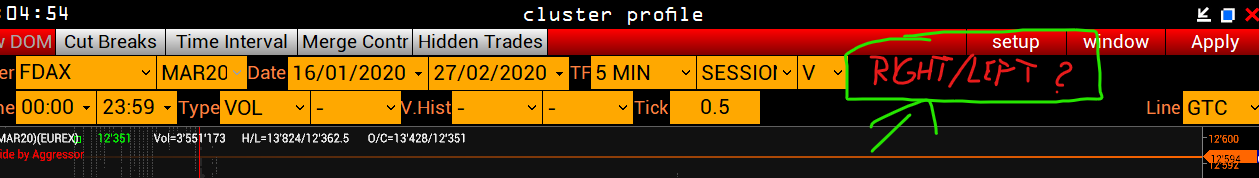

Histogramme Volume limit sell buy
Hello
A small modification please,
Cluster profile graph:
horz hist left limit; sellers: color in red
horz hist right limit buyers: color in green
Limit numbers:
option 1; the trader chooses his limit figures.
option 2; figures calculated by the program and based on the statistic of the normal distribution of the market profile ? ......
option 3; synchronization of sell and buy limit volumes, they are identical automatically.
Thanks.

Customer support service by UserEcho