Welcome to the support center of VolFix

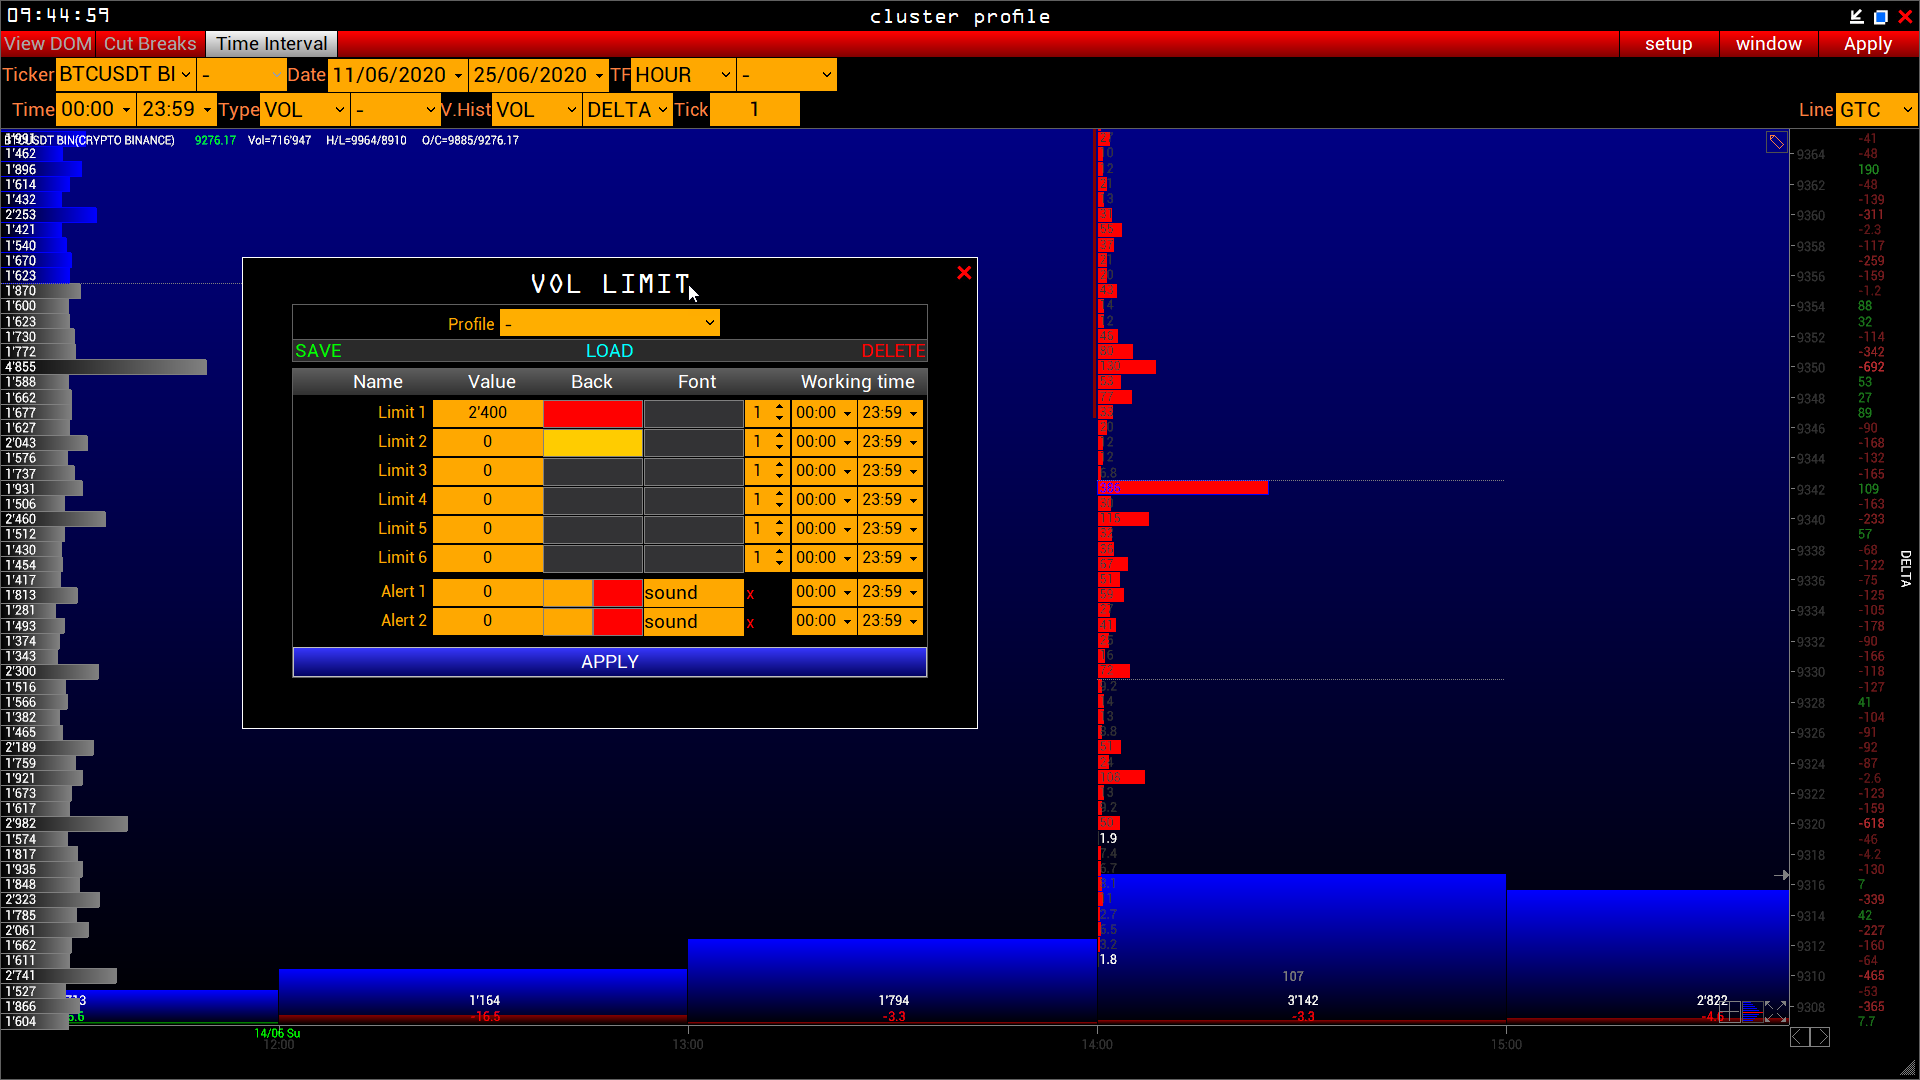
 Volume Limit Binance
Добрый день! Столкнулся с проблемой, что при работе с котировками криптовалютной биржи Binance Volume Limit работает некорректно. Выделяются все кластеры. Прилагаю скрины с описанной проблемой
1)
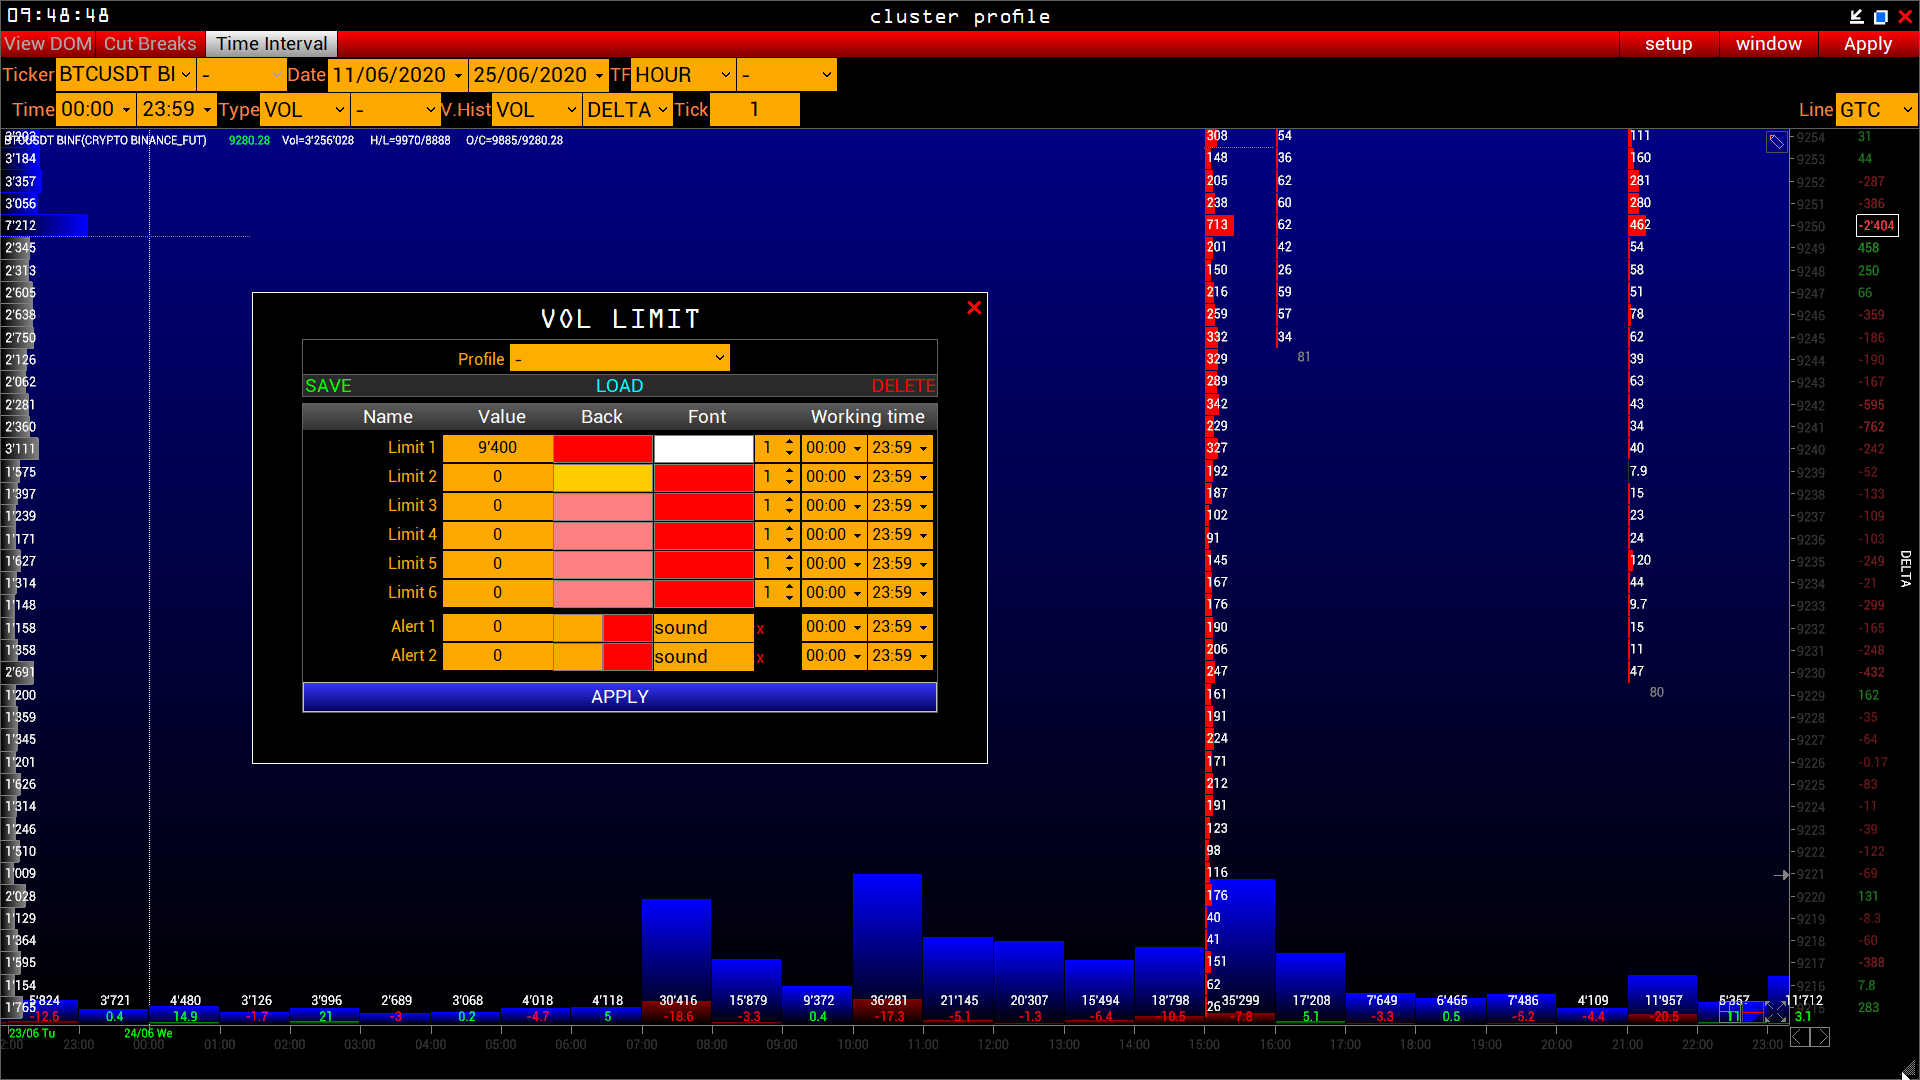
2) Такая же проблема характерна и для Binance Futures

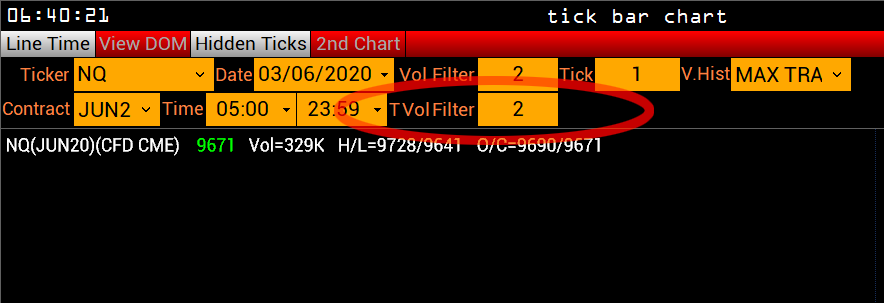
 Tick bar chart
Приветствую,
в tick bar chart сделайте пожалуйста окрашивание тиковых баров другим цветом, в которых есть скрытые тики. Сейчас приходится рисовать линии от нижней гистограммы объема, чтобы найти эти тики визуально.
Спасибо.

Уровень середины дня в классическом профиле.
Добрый день.
Можно ли сделать динамическую отметку середины дня в кл. профиле. Вот как на картинке.

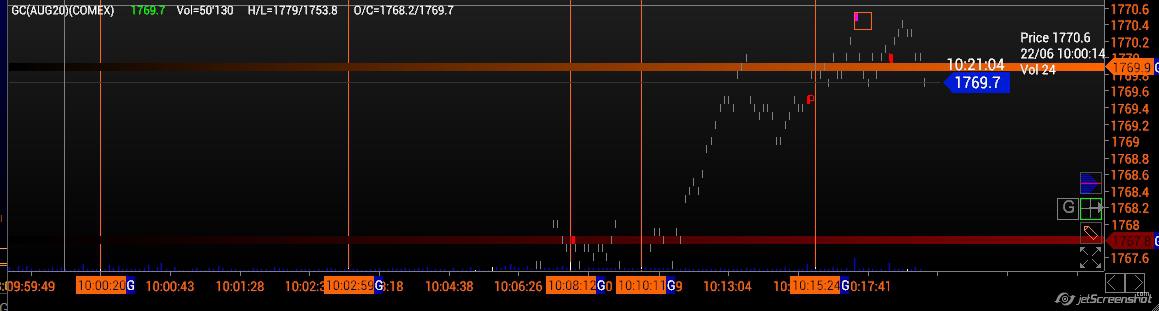
Tick Bar Chart - TradeVolume Filter
Предложение, - добавить фильтр по размеру пакетов к имеющемуся фильтру по объёму всего пакета в тике, Пример реализации ниже:
Сохранение лимитов и волюм-рэрджа реверсчарта в лайаутах
Вы видимо не поняли главного - было предложение сохранять в лайаут рэндж и лимиты реверсчарта - это же не перегрузит сам чарт, правда? Поскольку реверсчарт беден настройками по временнЫм интервалам валидности лимитов. Расширить настройки было как предложение - вы отвергли так как реверсчарт ресурсоёмок.
Вы как вариант предложили снапшоты - но оно вообще с лэйаутами никак не дружит как и не дружит даже с окном ордеров по отображению уровней.
Повторно: Предлагаю сохранять в лайаут рэндж и лимиты реверсчарта.

Сбор статистики изменения кол-ва ордеров в Dom.
Добрый день!
Сейчас на тикере RI наблюдаю, как заливают ордера на покупку, а рынок потихоньку снижают.
График настроен так, что показывает уровни цены по 50 pips (то есть укрупнен). Dom показывает одной строчкой, что в стакан в 5 верхних уровней цены интенсивно добавляют ордера со стороны BAY. То есть кто-то усиленно подставляет ордера на покупку и затаривается в LONG. В режиме реального времени, когда наблюдаешь это отчетливо видно, Справа на скрине выделил рамкой и указательной стрелкой.
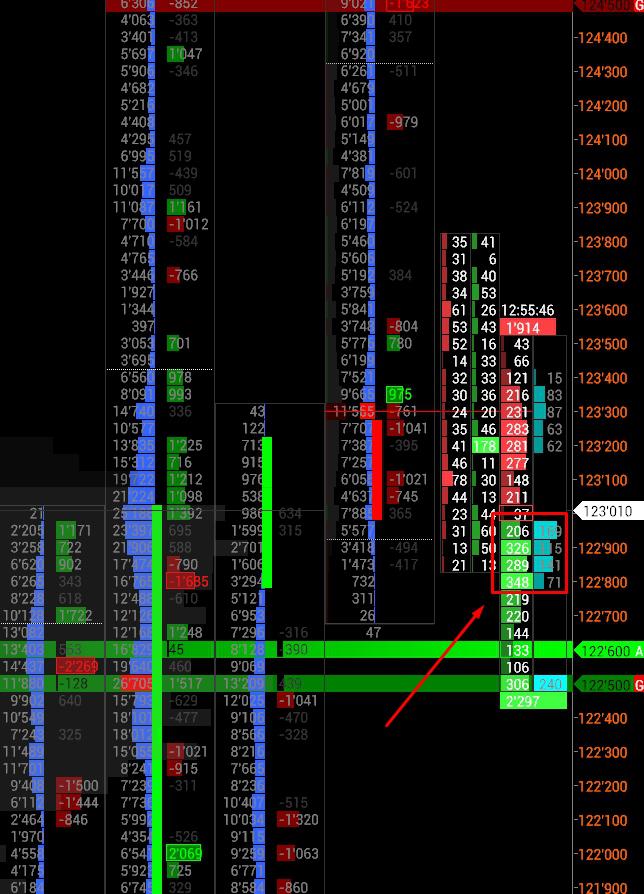
НО! когда смотришь в этот дневной кластер, то дельта на этих ценовых уровнях меняется! То перевес в одну сторону, то в другую. Получается, что предположительно над дельтой работают.
Я предлагаю сделать доработку к Dom, которая будет отдельно сохранять статистику по изменению количества ордеров в стакане. Вот как система видит, так пусть и запоминает изменения, а потом выводит в отдельный список статистический.
Список будет примерно такой (это мое личное видение, на рассмотрение). Все статистические данные в таблице вымышленные и приведены только для демонстрации примера:
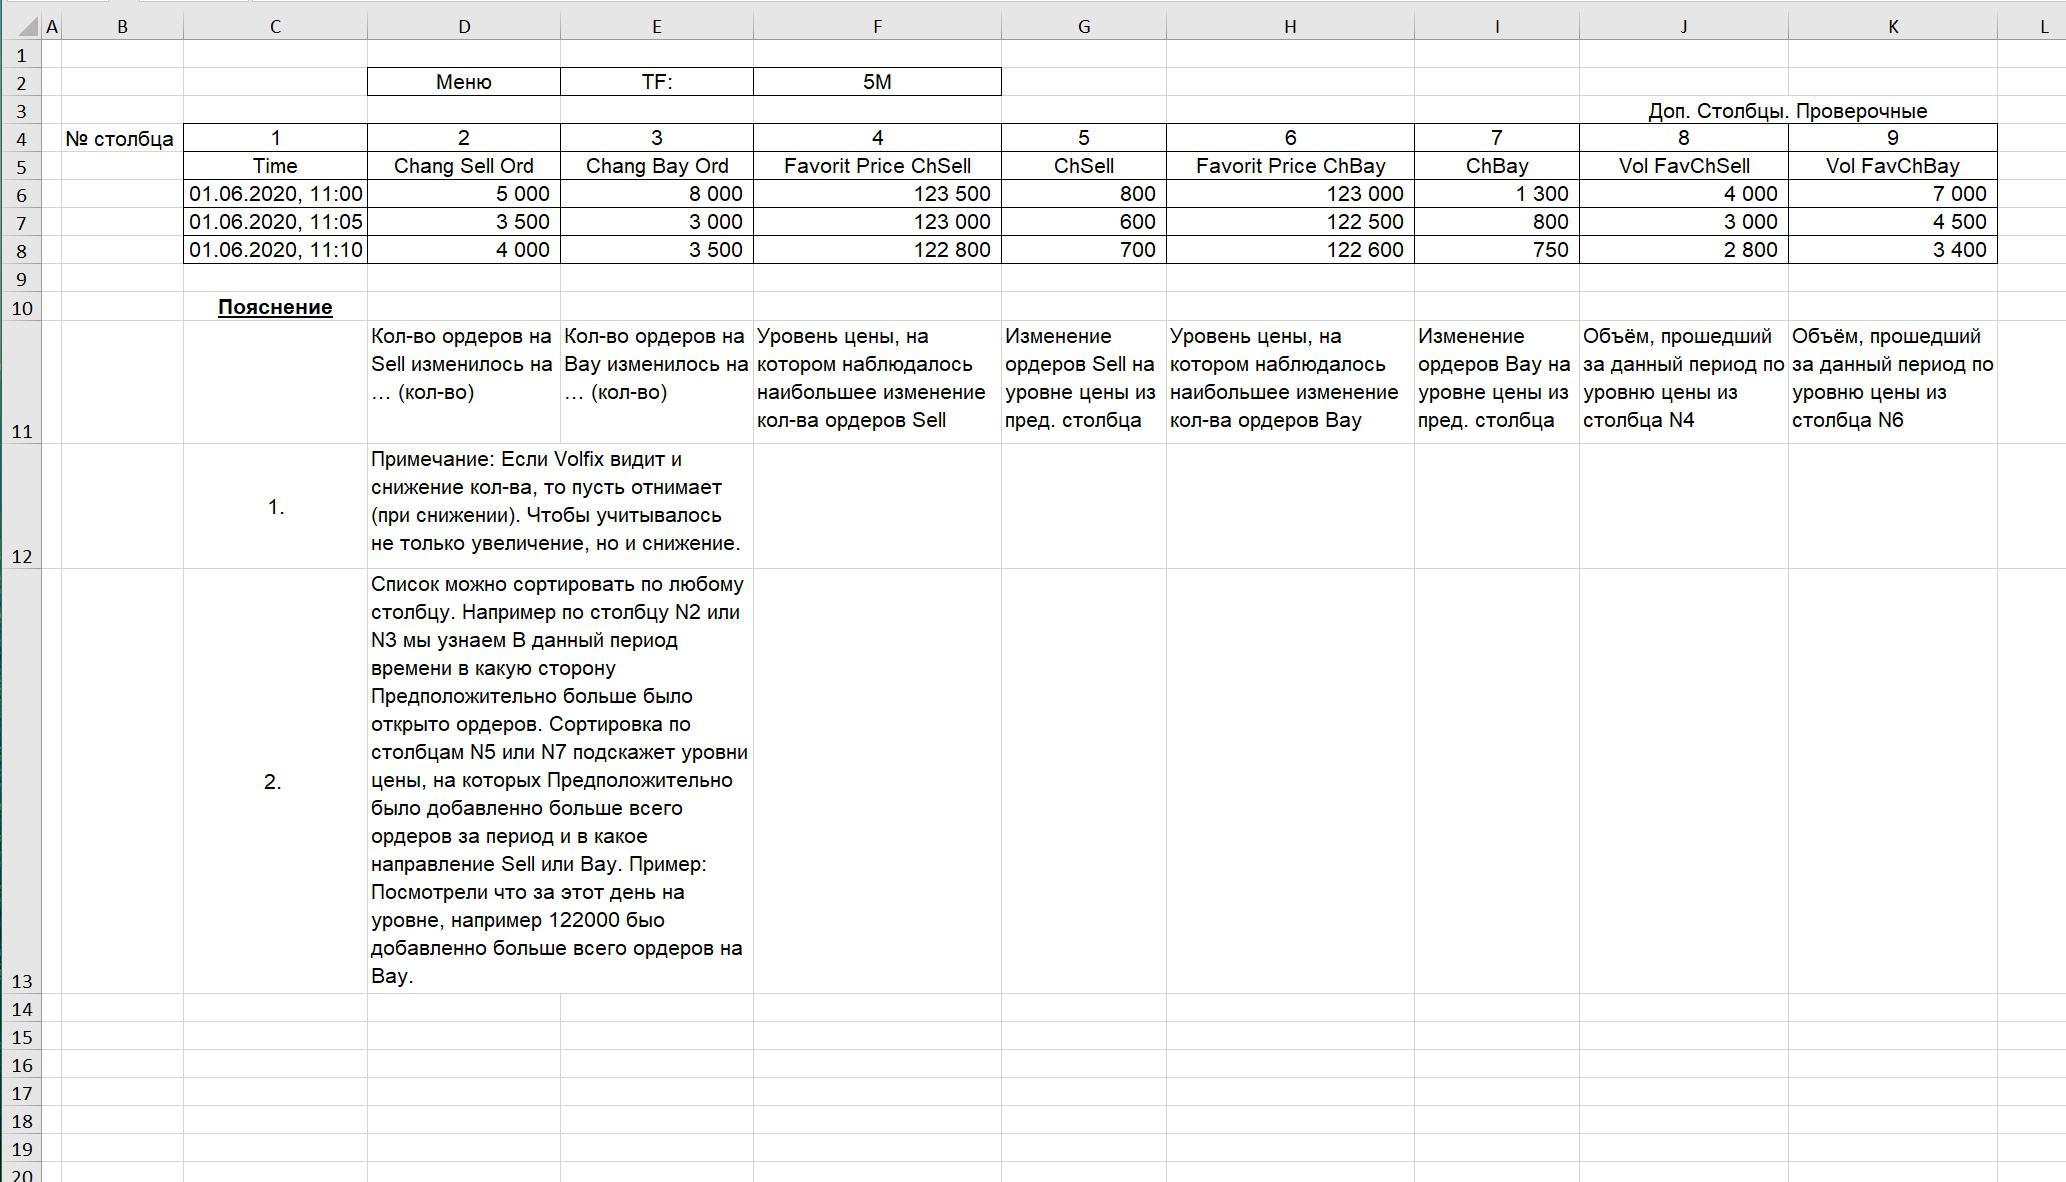
Эксель с данной таблицей прилагаю.Dom подсчет ордеров.xls

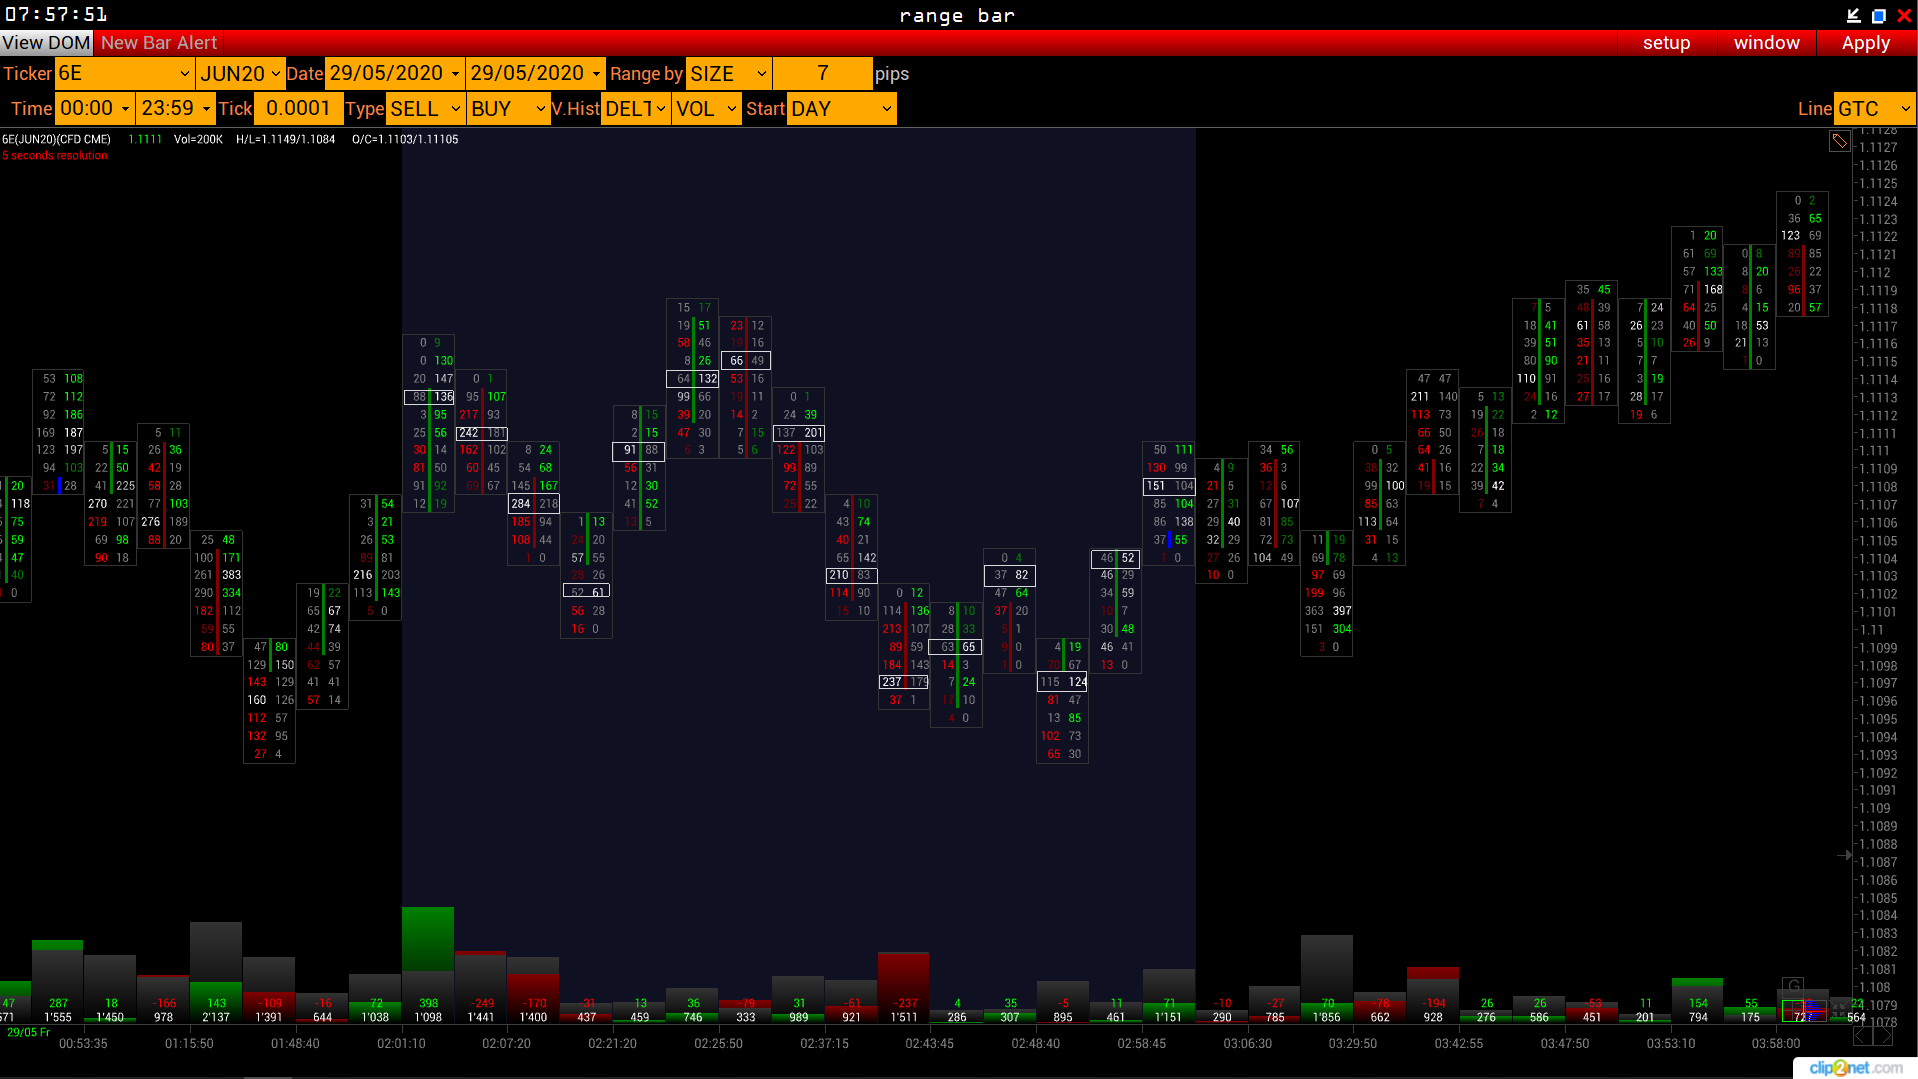
 Суммарный максимальный объем кластера при настройке отображения SELL/BUY
Добрый день.
Можно ли сделать выделение максимального объема суммарно в кластере, а не по Бидам и Аскам в отдельности как сейчас.
Вариант отображения на скрине.
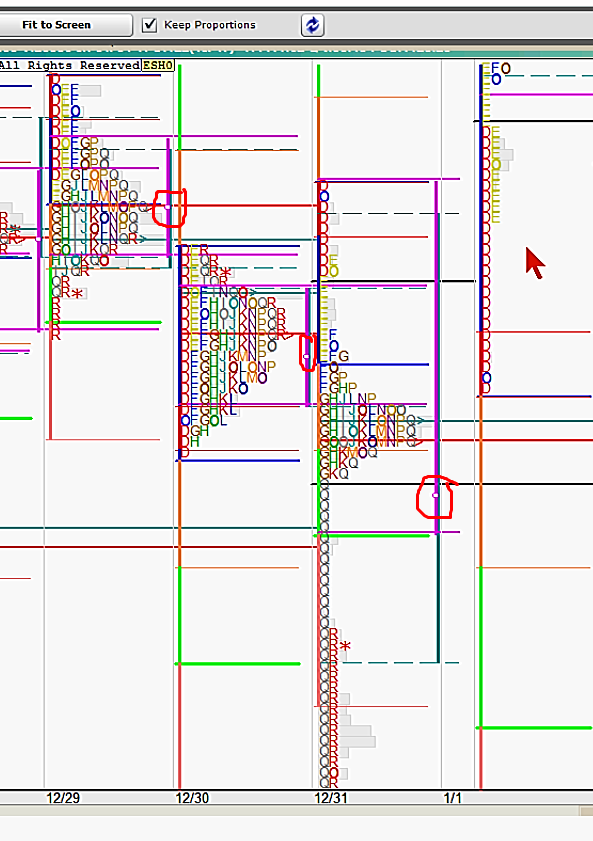
ReverseChart ещё один неприятный момент
похоже ReverseChart по причине того что долгое время не развивался, построен в устаревшей парадигме по отношению к другим чартам.
У уровней в этом чарте нет атрибута видимости "All windows"
Вроде бы мелочь, но это приводит к тому, что если мы откроем два таких чарта на один и тот же инструмент но с разными "Volatility" например - мне вот позарез нужно такое, - то в ордер Windows синхронно те уровни не отображаются. Нужно выбирать либо один реверсчарт либо другой. И те же уровни не отображаются синхронно-взаимно в обоих чартах и тд.
Подробнее:
Есть реверсчарт 1
Есть реверсчарт 2
Выставляю уровень в реверсчарт 1, а в реверсчарт 2 его нет)
Второй случай:
Есть реверсчарт 1
Есть реверсчарт 2
выставляю уровень в любой из двух чартах - его нет в ордервиндовс - нужно выбирать каждый раз откуда ордервинддовс должен брать уровни
И тд
Не могли бы поправить? - нужно лишь добавить атрибут видимости "All windows" в реверсчарт чтоб ы он адекватно работал как он работает в других чартах
Как выставить сессию не с 00:00 текущего дня, а с конца клиринга предыдущего дня?
Приветствую,
если сегодня 22 число, а я хочу выставить отображение графика с 20 числа 17:00 (сразу после клиринга) по текущий момент, то как это сделать?
Потому что сейчас выставляя время, получается такая картина (предыдущий день с 17:00, а текущего дня вообще нет так как в текущем дне 17:00 еще не наступило):
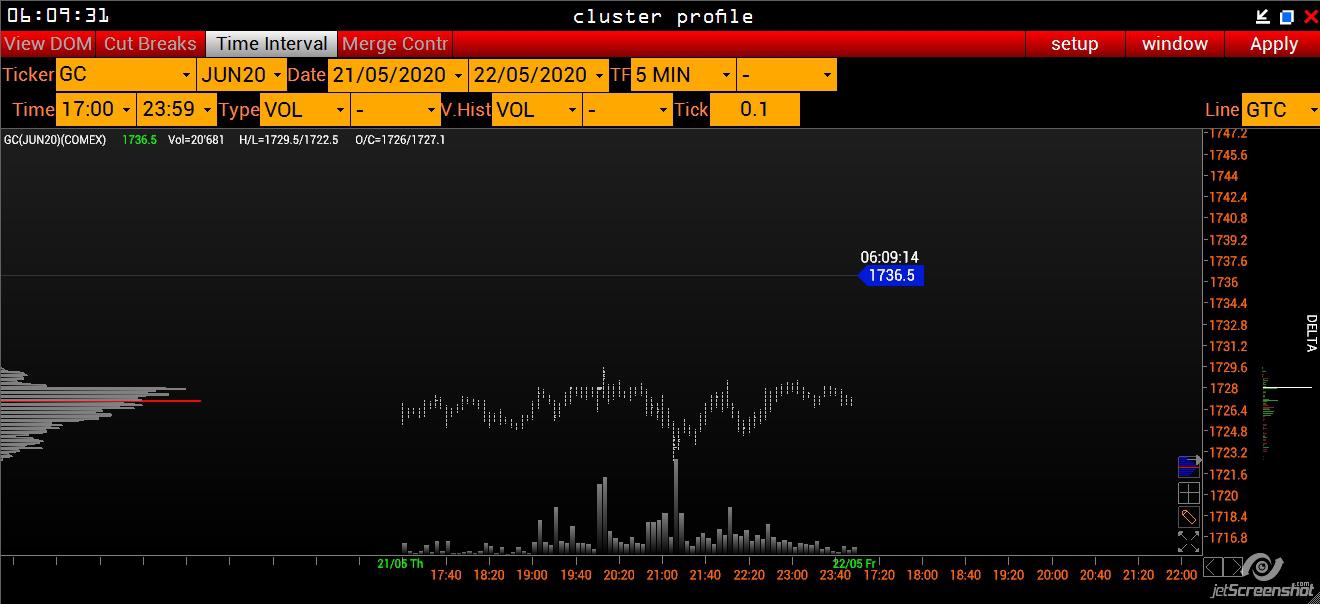
Если не реализовано, прошу добавить. Спасибо.

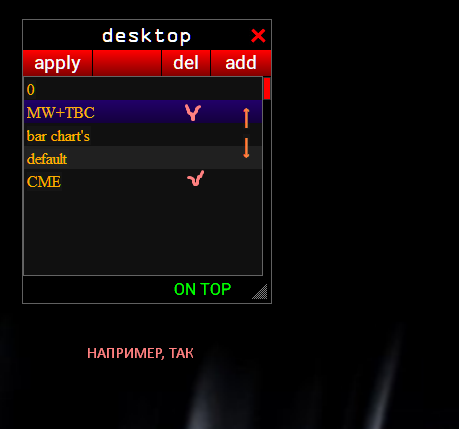
DeskTOP alerts
Здравствуйте.
Очень убедительная просьба добавить опционально установку алертов на какой-нибудь из рабочих столов, либо все выбираешь либо некоторые.
Очень удобно, используя много рабочих столов, не отвлекаться на не активные в данный момент рабочие столы, на которых "второстепенные" фин.инструменты, как вариант.
Спасибо.
Customer support service by UserEcho