Welcome to the support center of VolFix

 RTH CL start period in Volfix
Здравствуйте. При переключении графика CL в режим RTH сессия начинается в 8:30. Если я не ошибаюсь, сессия Crude Oil на NYMEX начинается с 8:00. Спасибо.
Hello. When switching the CL chart to RTH mode, the session starts at 8:30. If I am not mistaken, the Crude Oil session on NYMEX starts at 8:00. Thank you.

 VWAS indicator
Hello, (January 9, 2025).
1- VWAS indicator, --->add this general indicator. Seems interesting.
2- Profile P , --> add vwas, to test with vwap, calculation of differences., vertical histogram or other representation.....
Thanks.
Vertical line CVD
Hello,
"x" axis -->click
Multiple choice: style, visibility, note, margin, position, hide line, lock.
Add: Cumulative delta on/off (Cum Delta). Thanks.
Show a curve
Hello, best wishes for 2025 to the entire Volfix team and your family.
Vertical histogram--> Max Delta: on, so the program is active. Impossible to enter px=0 or %=0 so as not to display the curve.
A change?. Thank you.

 Strange display of clusters with configured volume limits on linux
Hello,
If I select the draw size greater than zero, then a strange square appears next to the clusters instead of selecting the cluster itself.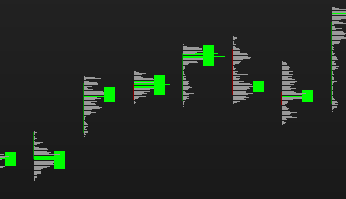
Maybe I configured something incorrectly, maybe this is a problem with the Linux application.
The limit settings:
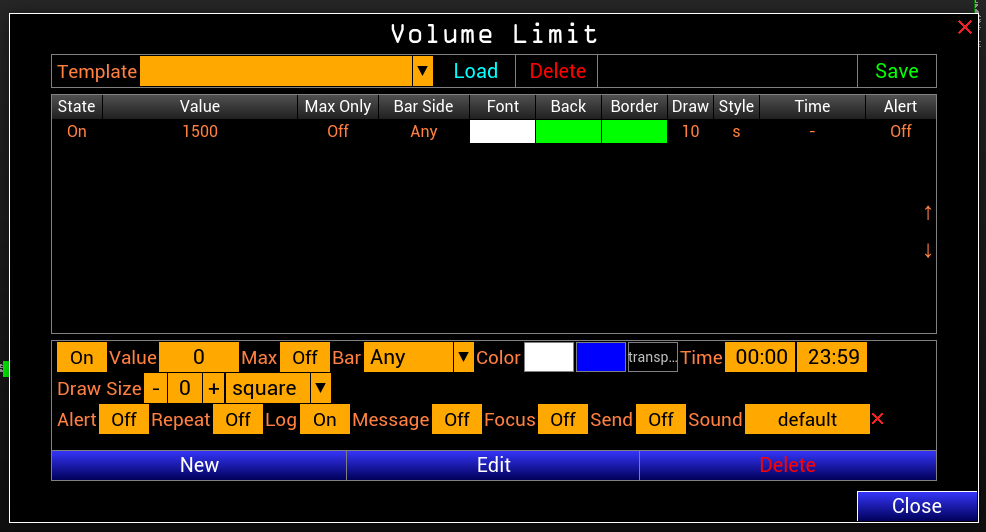
How to fix it ?

Отображение сделок на графике
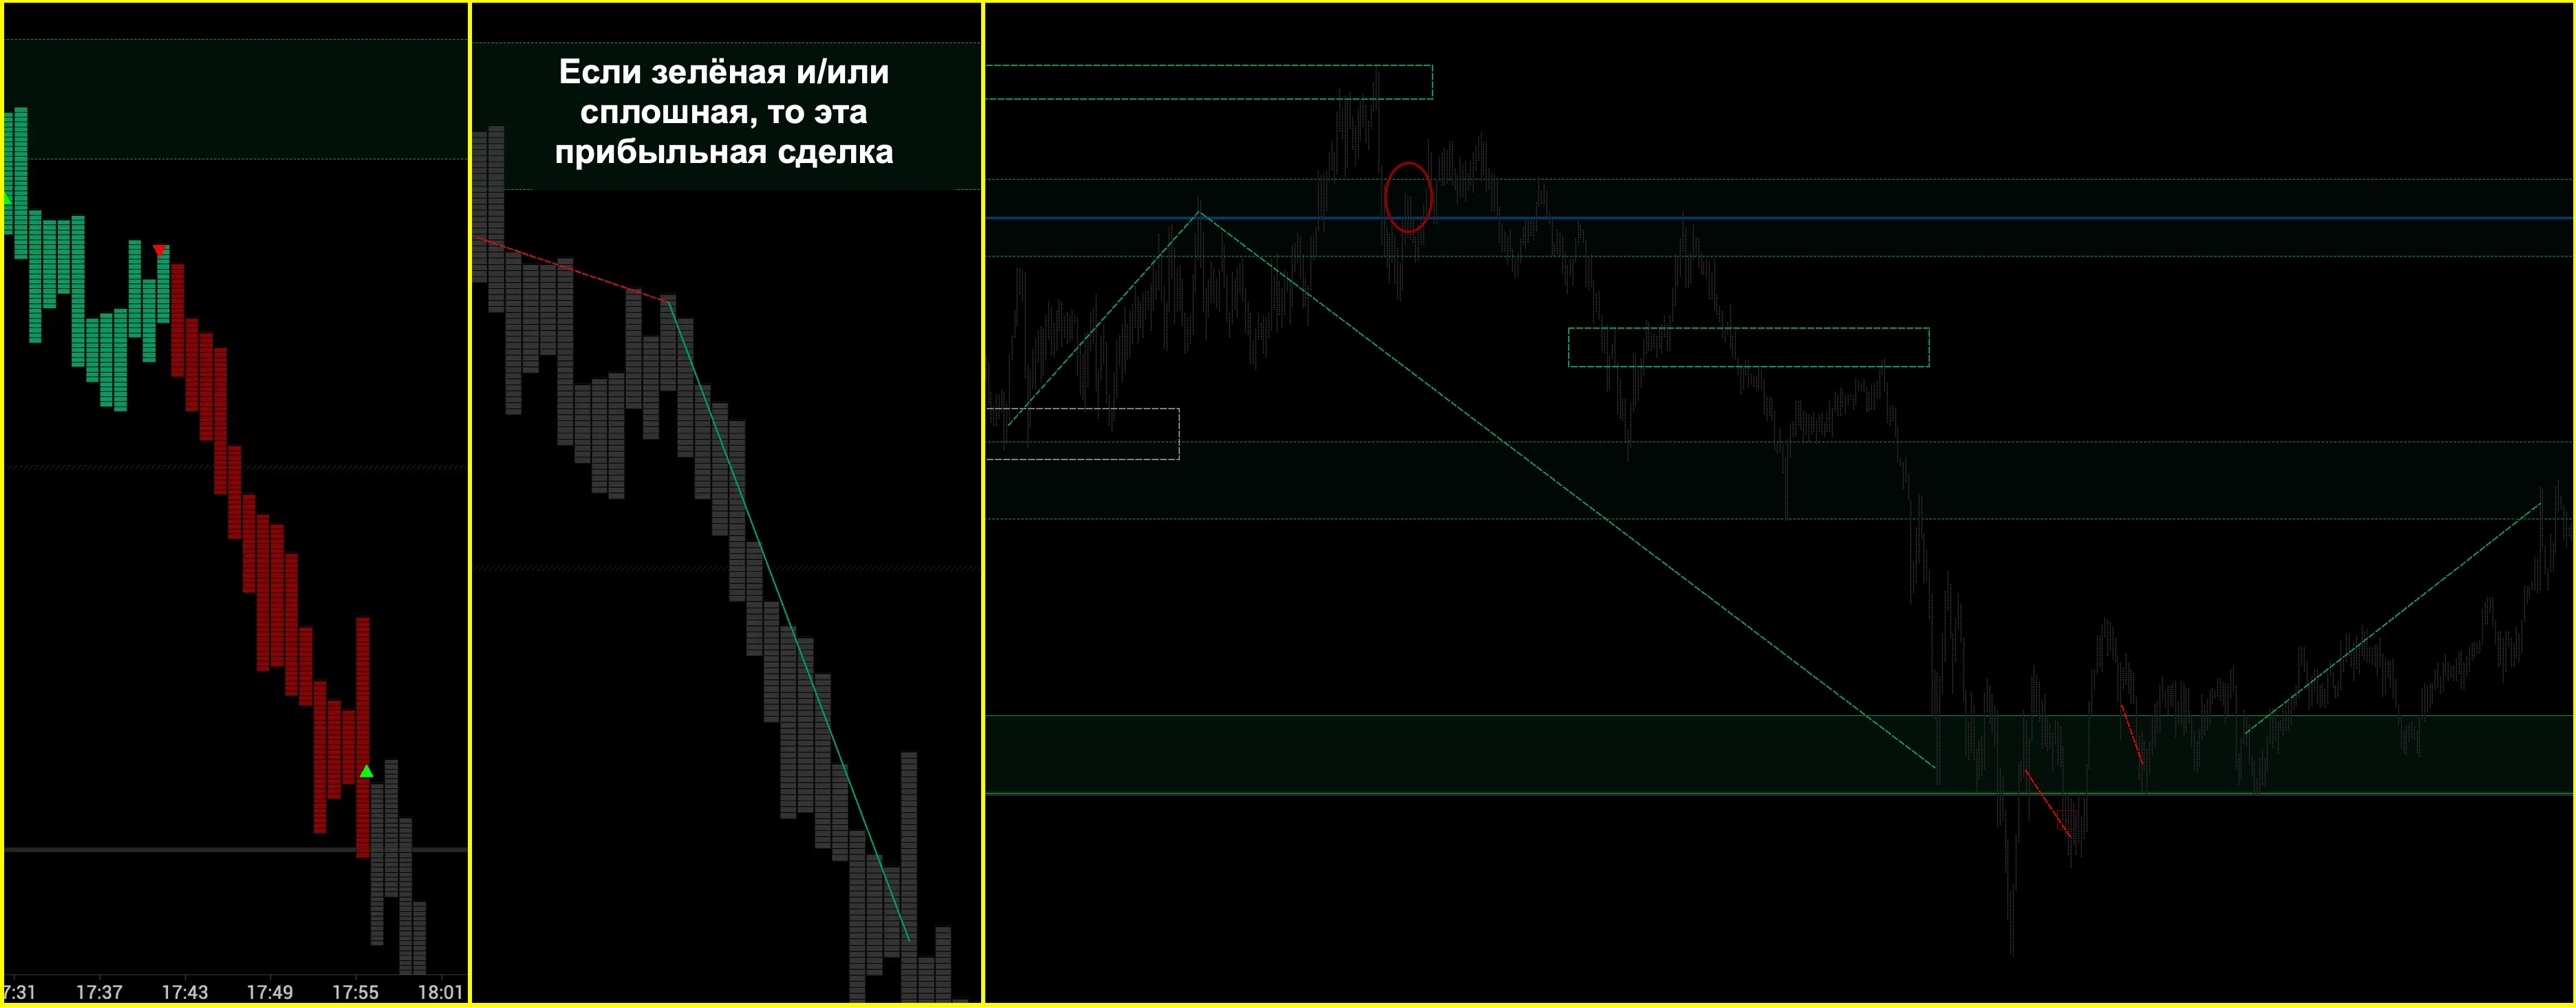
Высокая потребность в такой реализации отображения сделок.
1. При сжатом графике трейдер фактически получает наглядно-визуальную, графическую статистику.
2. Точки входа и выхода в таком виде визуально точнее.
3. Если трейдер путает цвета, то для него ещё полезнее, особенно если сделать например отрицательные сделки - пунктирной линией, а положительные сплошной.

Hi Guys ! Any break-even hotkey under the hood ?
I know it's been requested many times, but here we go again, could you please consider implement this very basic feature ?
When market becomes very volatile, to this day it's very difficult to properly adjust the SL to the right price.
Thank you very much
AUTO-FOLLOW
Hi Guys !
Working on a laptop, and splitting my screen into 4 tiny chart screens, it appears that there is no "auto-follow last cluster/last bar", or "center last cluster/last bar" function, and we have to manually move the cluster when it has the tendency to move to the right side of the screen, soon being off-chart.
Can we fix that ?
Does such a function already exists ?
Thank you, kind regards

График по временному интервалу
Добрый день, прошу вернуть в настройки платформы показ графика по временному интервалу и соответственно добавить настройку индикации цены открытия и закрытия выбранного периода
Customer support service by UserEcho