Welcome to the support center of VolFix

 Idea Classic Profile, Line Settings, Candles Cluster-Profile
Hello,
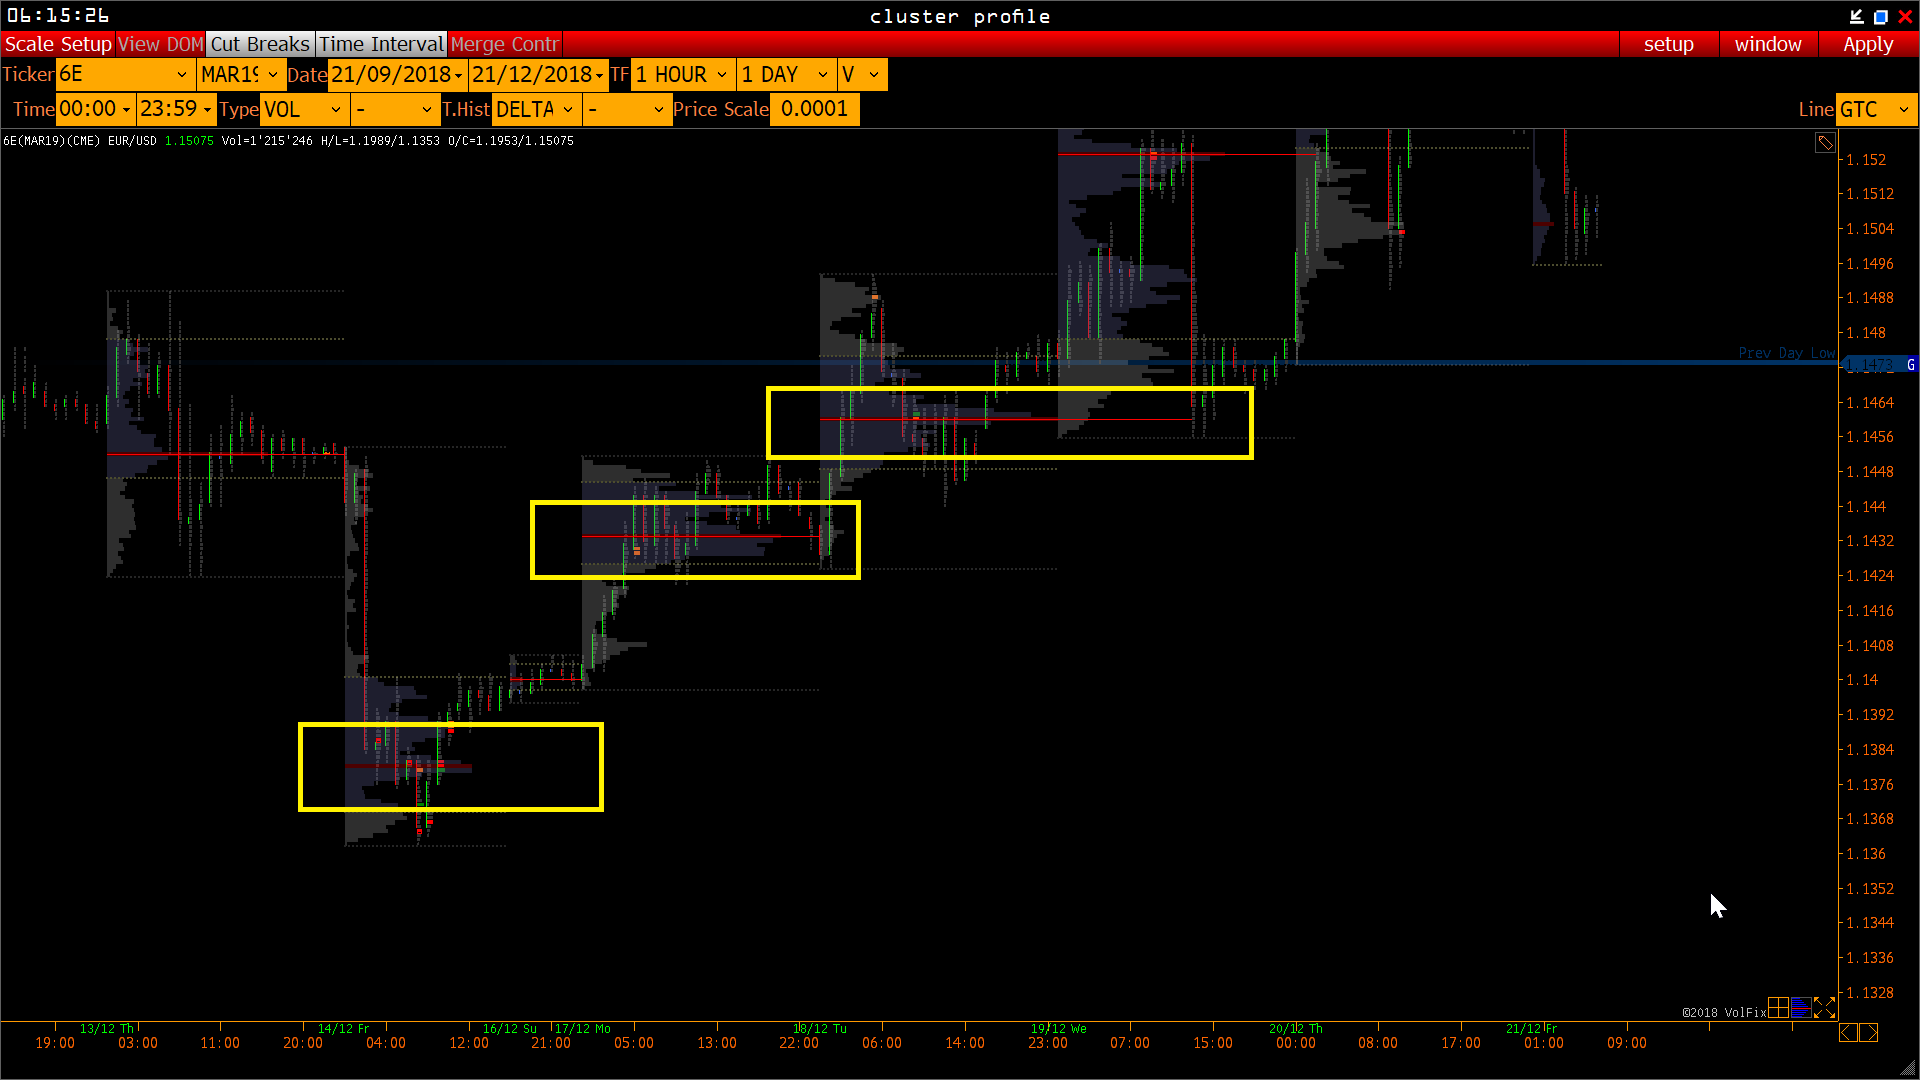
is it possible to make the candlesticks in the cluster profile manually customizable? The width of the candle body.
Unfortunately, at the moment the body is hardly recognizable by the wick.
Classic profiles - Running profiles:
Is it possible to add the option that with the possibility of running profiles optional only single "candles" are opened and not all?
In addition, it would be helpful if several days could be merged at will, e.g. at Inside Days and want to present this as a profile with the previous day.
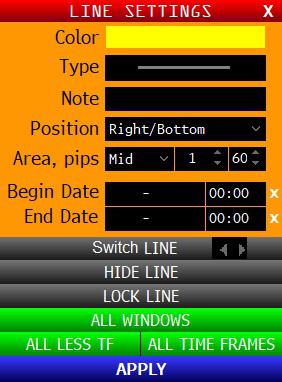
Is it possible, if several lines are placed on a price, if the arrangement of the lines (see picture) in the submenu can be scanned directly between the lines. (left and right arrow on the picture. (is an idea to implement it)
See "Switch Line left arrow, right arrow"
thanks

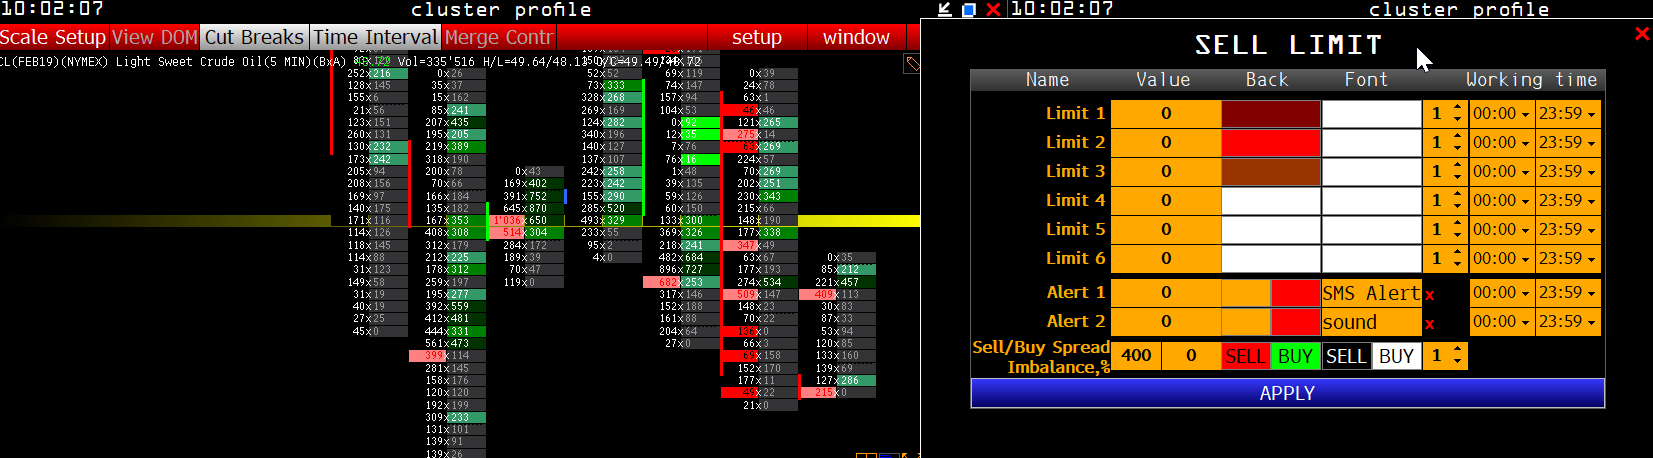
Предложение по Classic Profile. Running Profile за весь период/только текущая сессия
Предлагаю доработать ф-л Running Profile, чтобы можно было выбрать раздвигать только профиль текущей сессии или все. Вот пример реализации

Сохранение настройки "перекрестия" в layout
При сохранении layout'а, не сохраняется настройка:
- вкл перекрестие,
- вкл глобального перекрестия.
Неудобно каждый раз при загрузке layout'а, заново включать перекрестие, глобальное перекрестие.

 размер шрифтов уменьшается при включенном Open GL
почему размер шрифтов так сильно уменьшается если включить OpenGL?
особенно это заметно на экранах высоким разрешением (в частности на ноутбке с разрешением 2736х1824)
прошу исправить

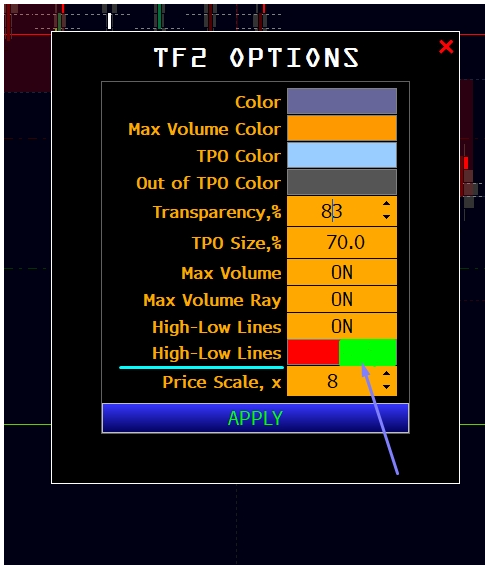
TF2 OPTIONS
Здравствуйте.
Уважаемые разработчики, будьте так любезны, доработайте немного модуль TF2 OPTIONS как это показано на скрине, очень нужная вещь.
Заранее благодарен.
Alert line
Здравствуйте. Если не затруднит, не могли бы Вы добавить опцию - автоматической индикации даты выставления линии алерта (на самой линии). Просьба относится только к линии алерта, на другие линии не распространяется. В идеале, конечно, с указанием времени, но это по возможности.
Спасибо.

POC Line
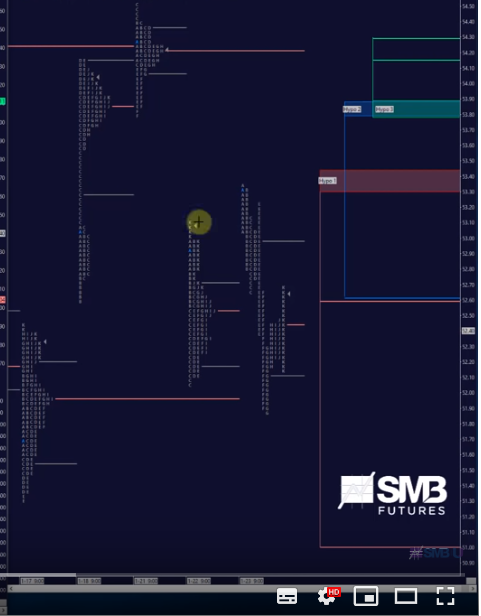
The POCs in my chart looks a bit confusing..
.. the first one is bold and ends at the end of the volume profile..
.. the second one is thin and ends at the end of the day..
.. the third one is thin and goes into the following day.
Looks like a bug?!

Перемещение экрана в графическом режиме (режиме рисования)
Можно сделать, скажем, через нажатый Альт перемещение экрана мышкой как это происходит в обычном режиме (вне режима рисования).
Приходится выходить из режима, - перемещать экран, - далее снова входитчто бы продолжить работу с графикой.
Через нажатия Альт-а было бы проще.
Ещё понятнее: В графическом режиме, нажимая и удерживая Альт, можно бы было перемещать экран по времени как это делается в обычном рабочем режиме,

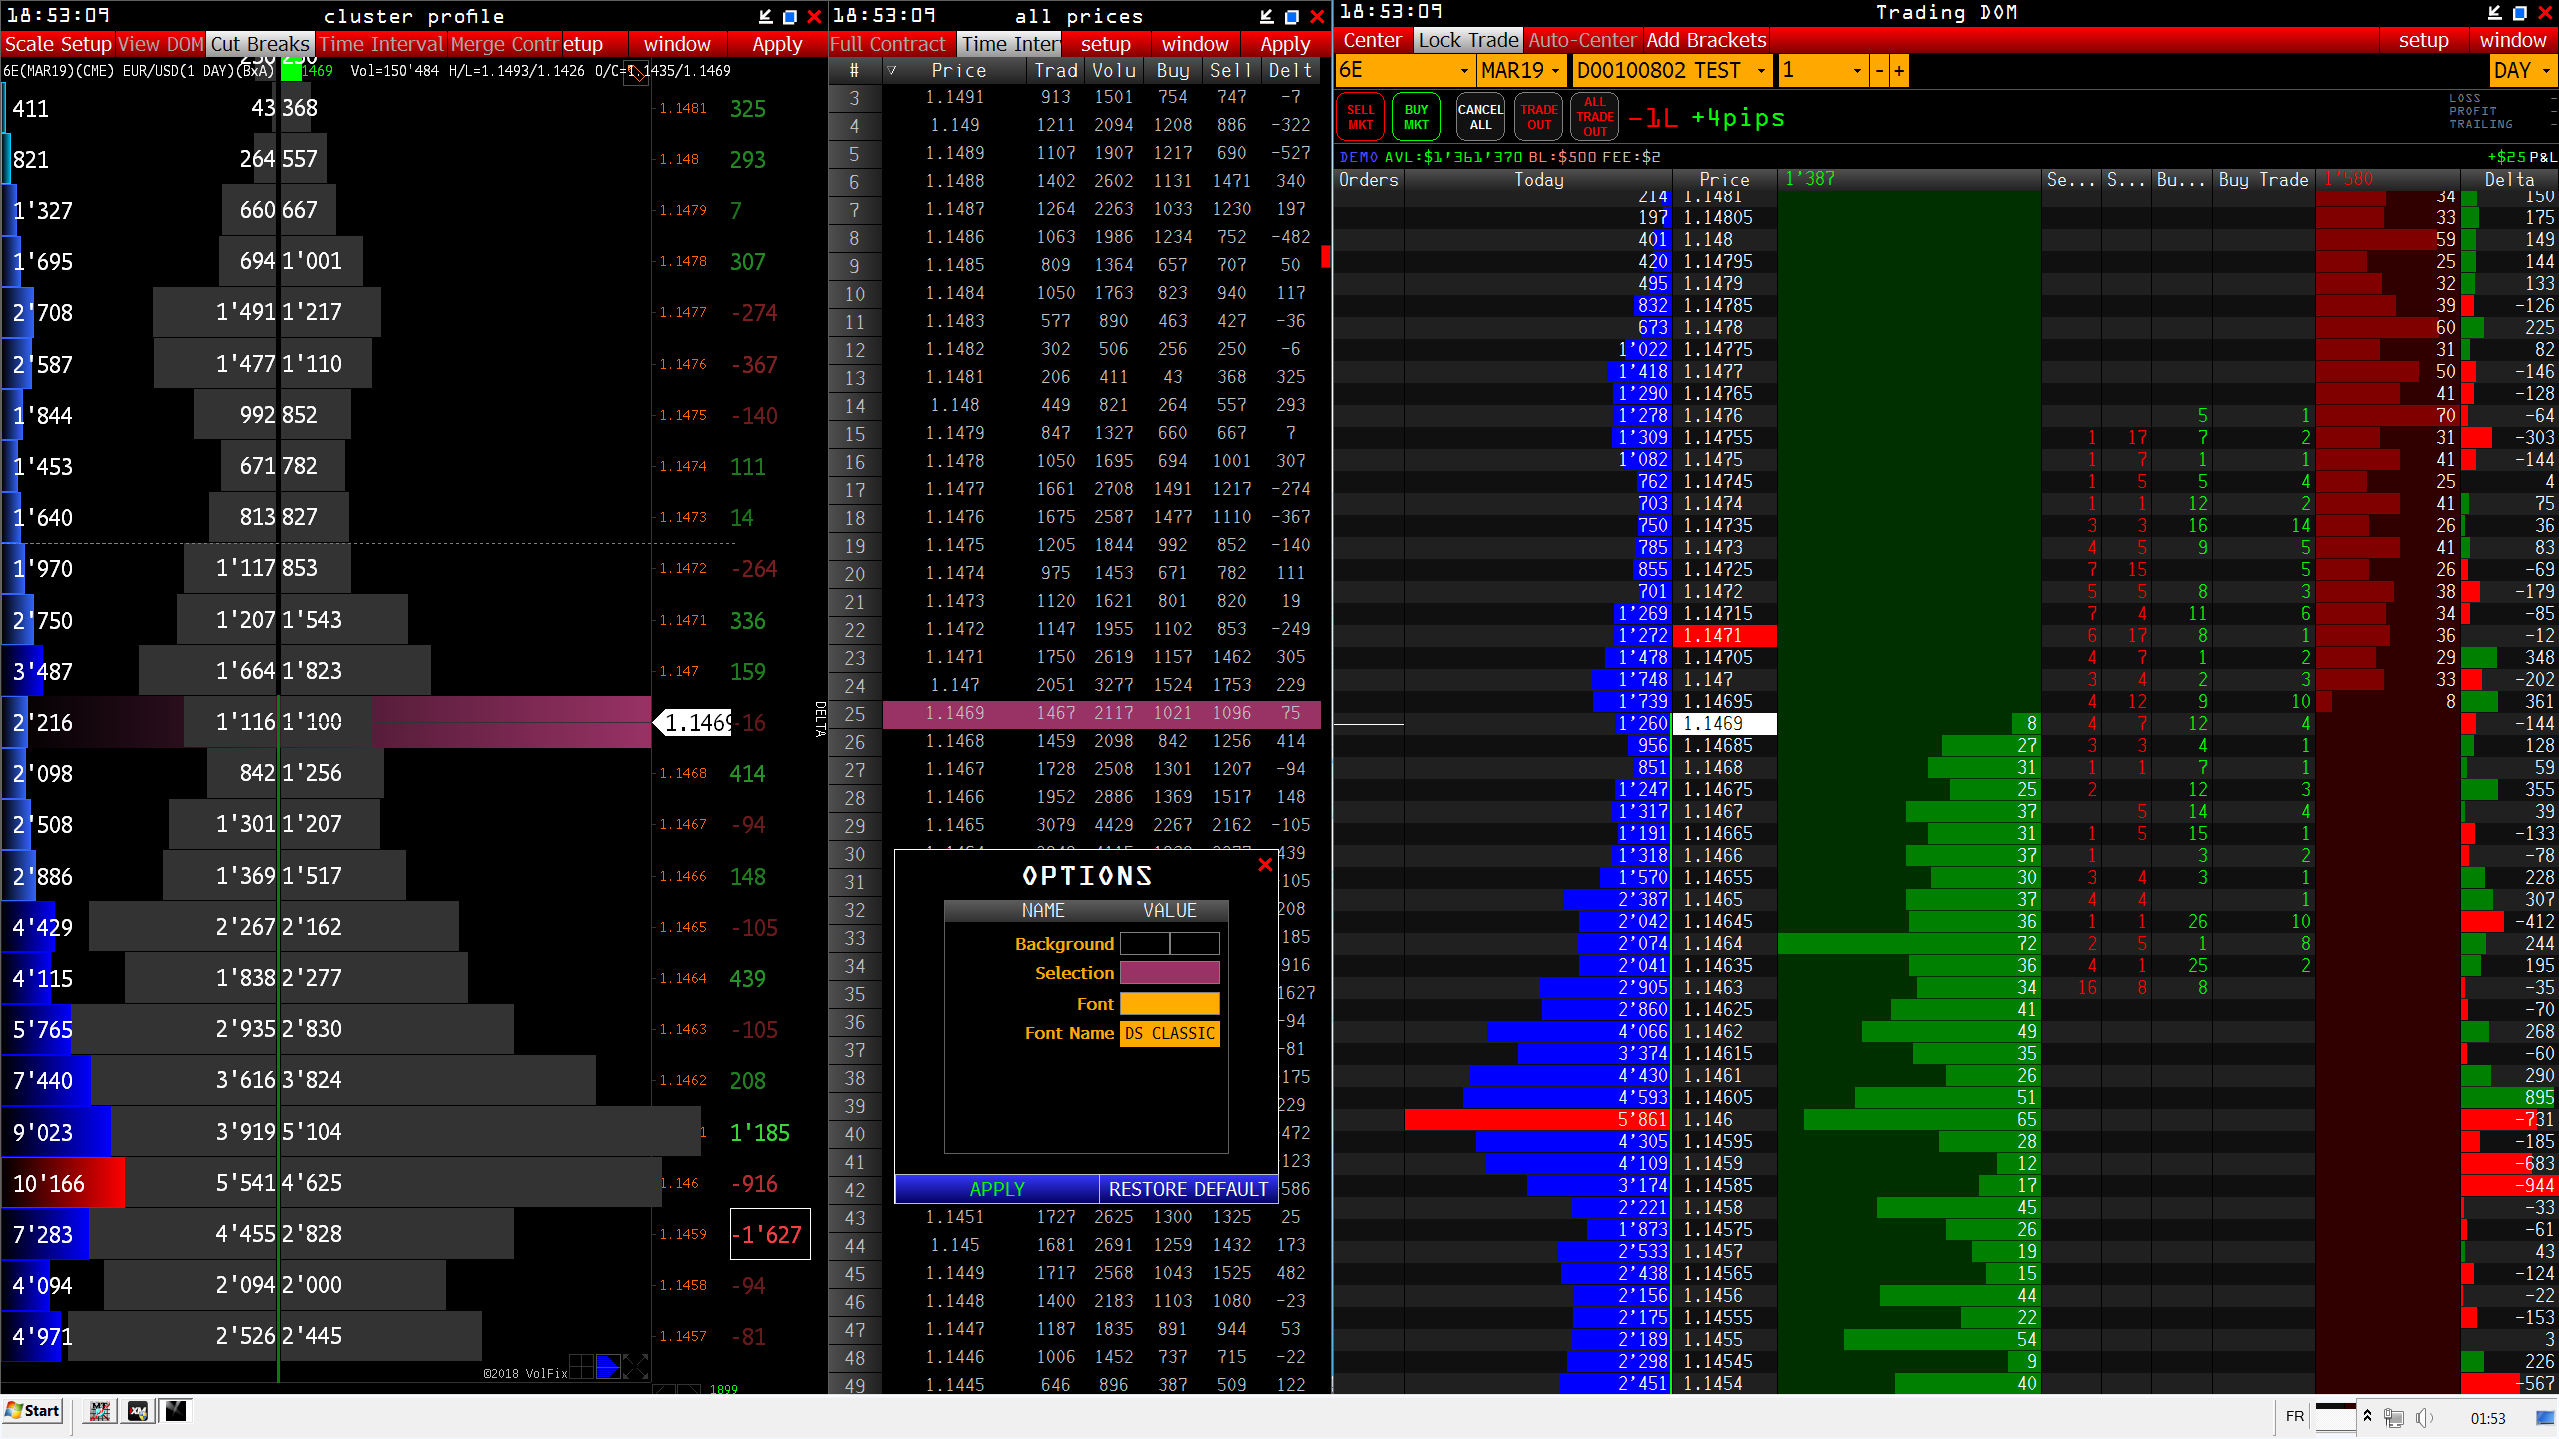
Option level selection + Trading Dom
Hello
A very small idea ..
Can you add a level selection option on trading dom or a cross
Thank you
-----------------------------------------
привет
Очень маленькая идея ..
Можете ли вы добавить опцию выбора уровня на Dom Trading или кросс
спасибо
------------------------------------------
Footprint Limits
I don't have any volume filters. Why is everything in colors? The only color should be for imbalances..
Customer support service by UserEcho