Welcome to the support center of VolFix

 Профиль рынка Time Frime 2. Отображение слоя - график/профиль
1.При установки настройки минимального % прозрачности (Opnion - TF 2 Transparency, %) профиль рынка становится более четким и следовательно не видно какая была динамика графика с проходимыми в них фильтрами по объему и дельте. Рисунок 1.
2. При установки настройки максимального % прозрачности профиля рынка становится боле четким график и его фильтры но мене четким сам профиль. Рисунок 2.
Приходится искать золотую середину!!!
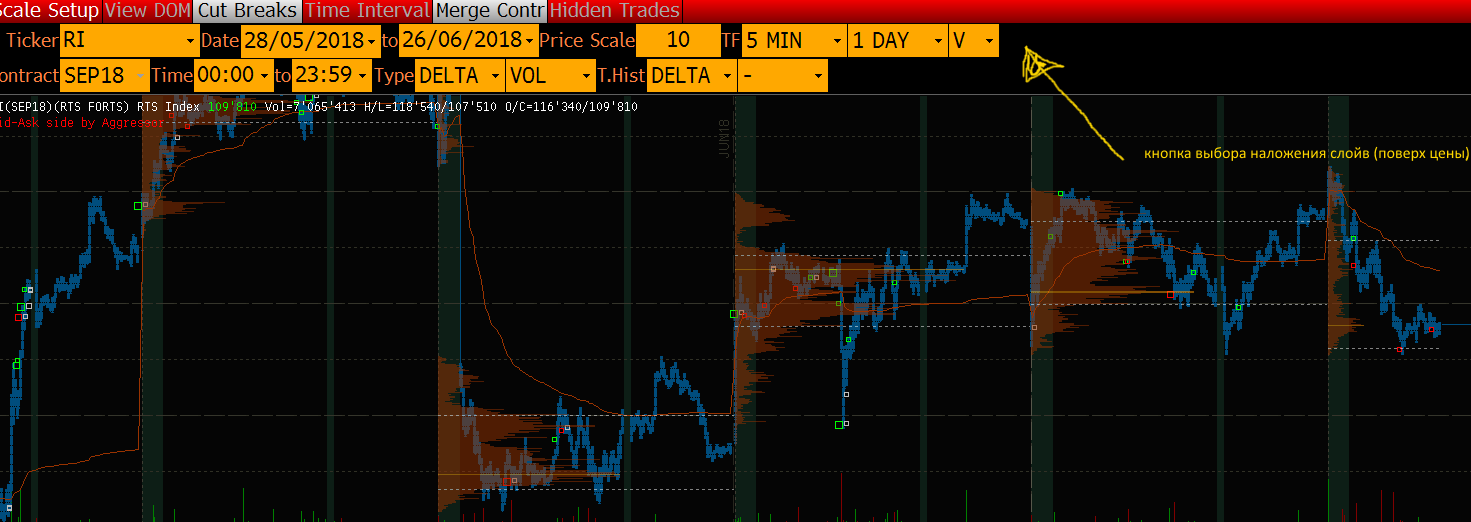
В связи с выше изложенным - можно рассмотреть вопрос о возможность изменения наложения слоя отображения - сначала график виден с его фильтрами а потом профиль рынка. В данном исполнении было бы и график виден с фильтрами и у профиля рынка не нужно понижать прозрачность. (актуально для людей с не очень хорошим зрением)
Данную функцию можно расположить сверху на панели окна. Рисунок 3
Рисунок 1
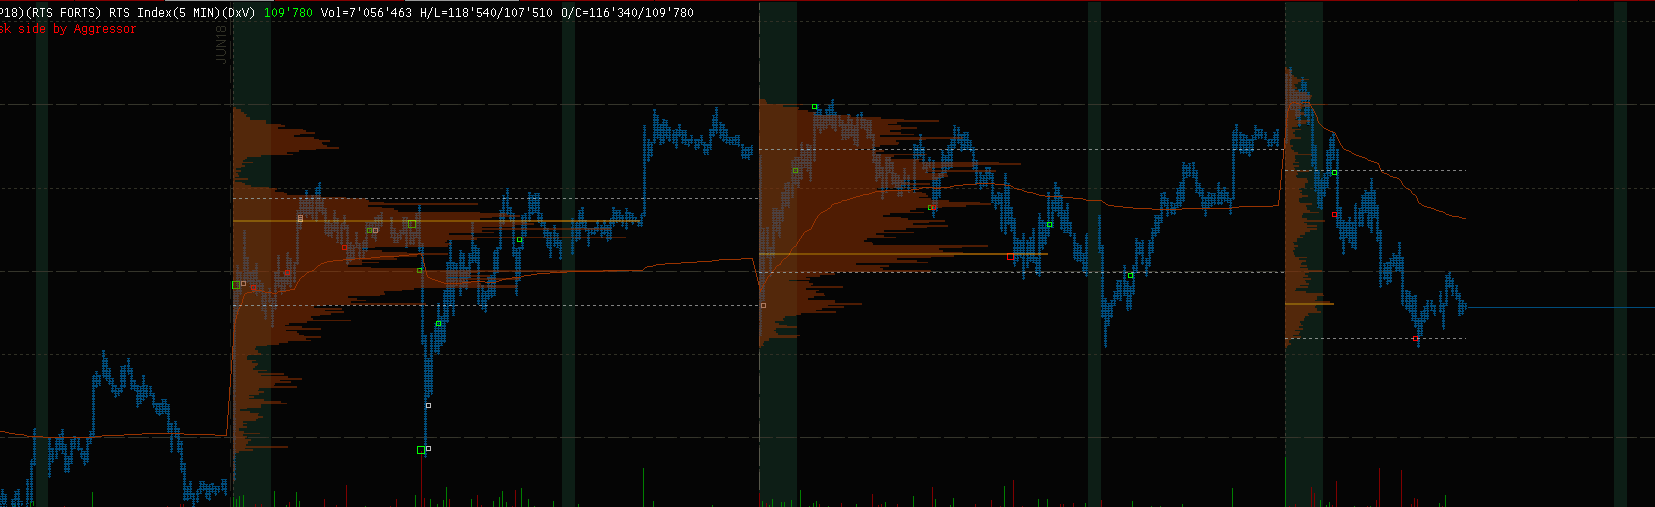
Рисунок 2
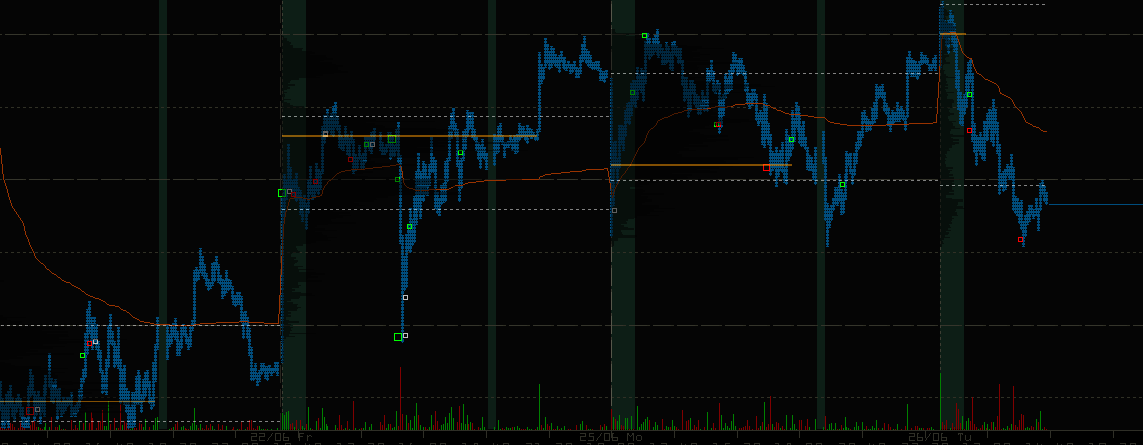
Рисунок 3

Reverse Chart. Alert Volume
Доброго времени суток! скажите можно сделать в Reverse Chart , Alert на выход обьема


Несколько профилей на графике
Дайте возможность натягивать сетку профиля столько раз сколько захочу на любом месте графика.
Вот пример как это могло-бы выглядеть.

Если необходимо много профилей на графике, как правило для этого хорошо подходит функция второго time frame (TF2). Она доступна и в Cluster Profile и Box Chart.

Copy a Line
When you duplicate a row, the data in the new row remains identical to the source row, except for the visibility settings. However, the copied line has the visibility value set to "Current Only" even though the original line, for example, stated "Less TF".
Could you modify this to ensure that the visibility field is also inherited from the source?

Line layouts, templates and clonning the line
It would have been nice to have line layouts such as;
-For buy levels set a colour, lets say green dotted line. Save the layout and next time when you need to draw a buy level simply just choose the layout.
-Also clonning the line would have been a great tool to have. For example click the line while press and hold ctrl clones the line and you can have the second exactly same line(colour,style, margin, note etc.)
Thanks for the support.

Symbol field drop down - select item with keyboard
Hello Team
my request concerns the "Symbol" selection field. Thus it's valid for charts as well as for statistics windows.
Every time I type a stock symbol into the text field "Symbol", my reflex is to click the "down arrow" key on my keyboard. This is the standard behaviour in application UX design and in Web Development when a dropdown shows up allowing the user to select an item from the auto suggestion list.
Unfortunately in Volfix I can only navigate to an entry in the suggestion list using the mouse. The same is true for the symbol selection. This can exlusively done per mouse click.
Would it be possible to enable the navigation using the arrow up and arrow down keys to navigate to an item and select it just clicking the enter key?
Kind regards

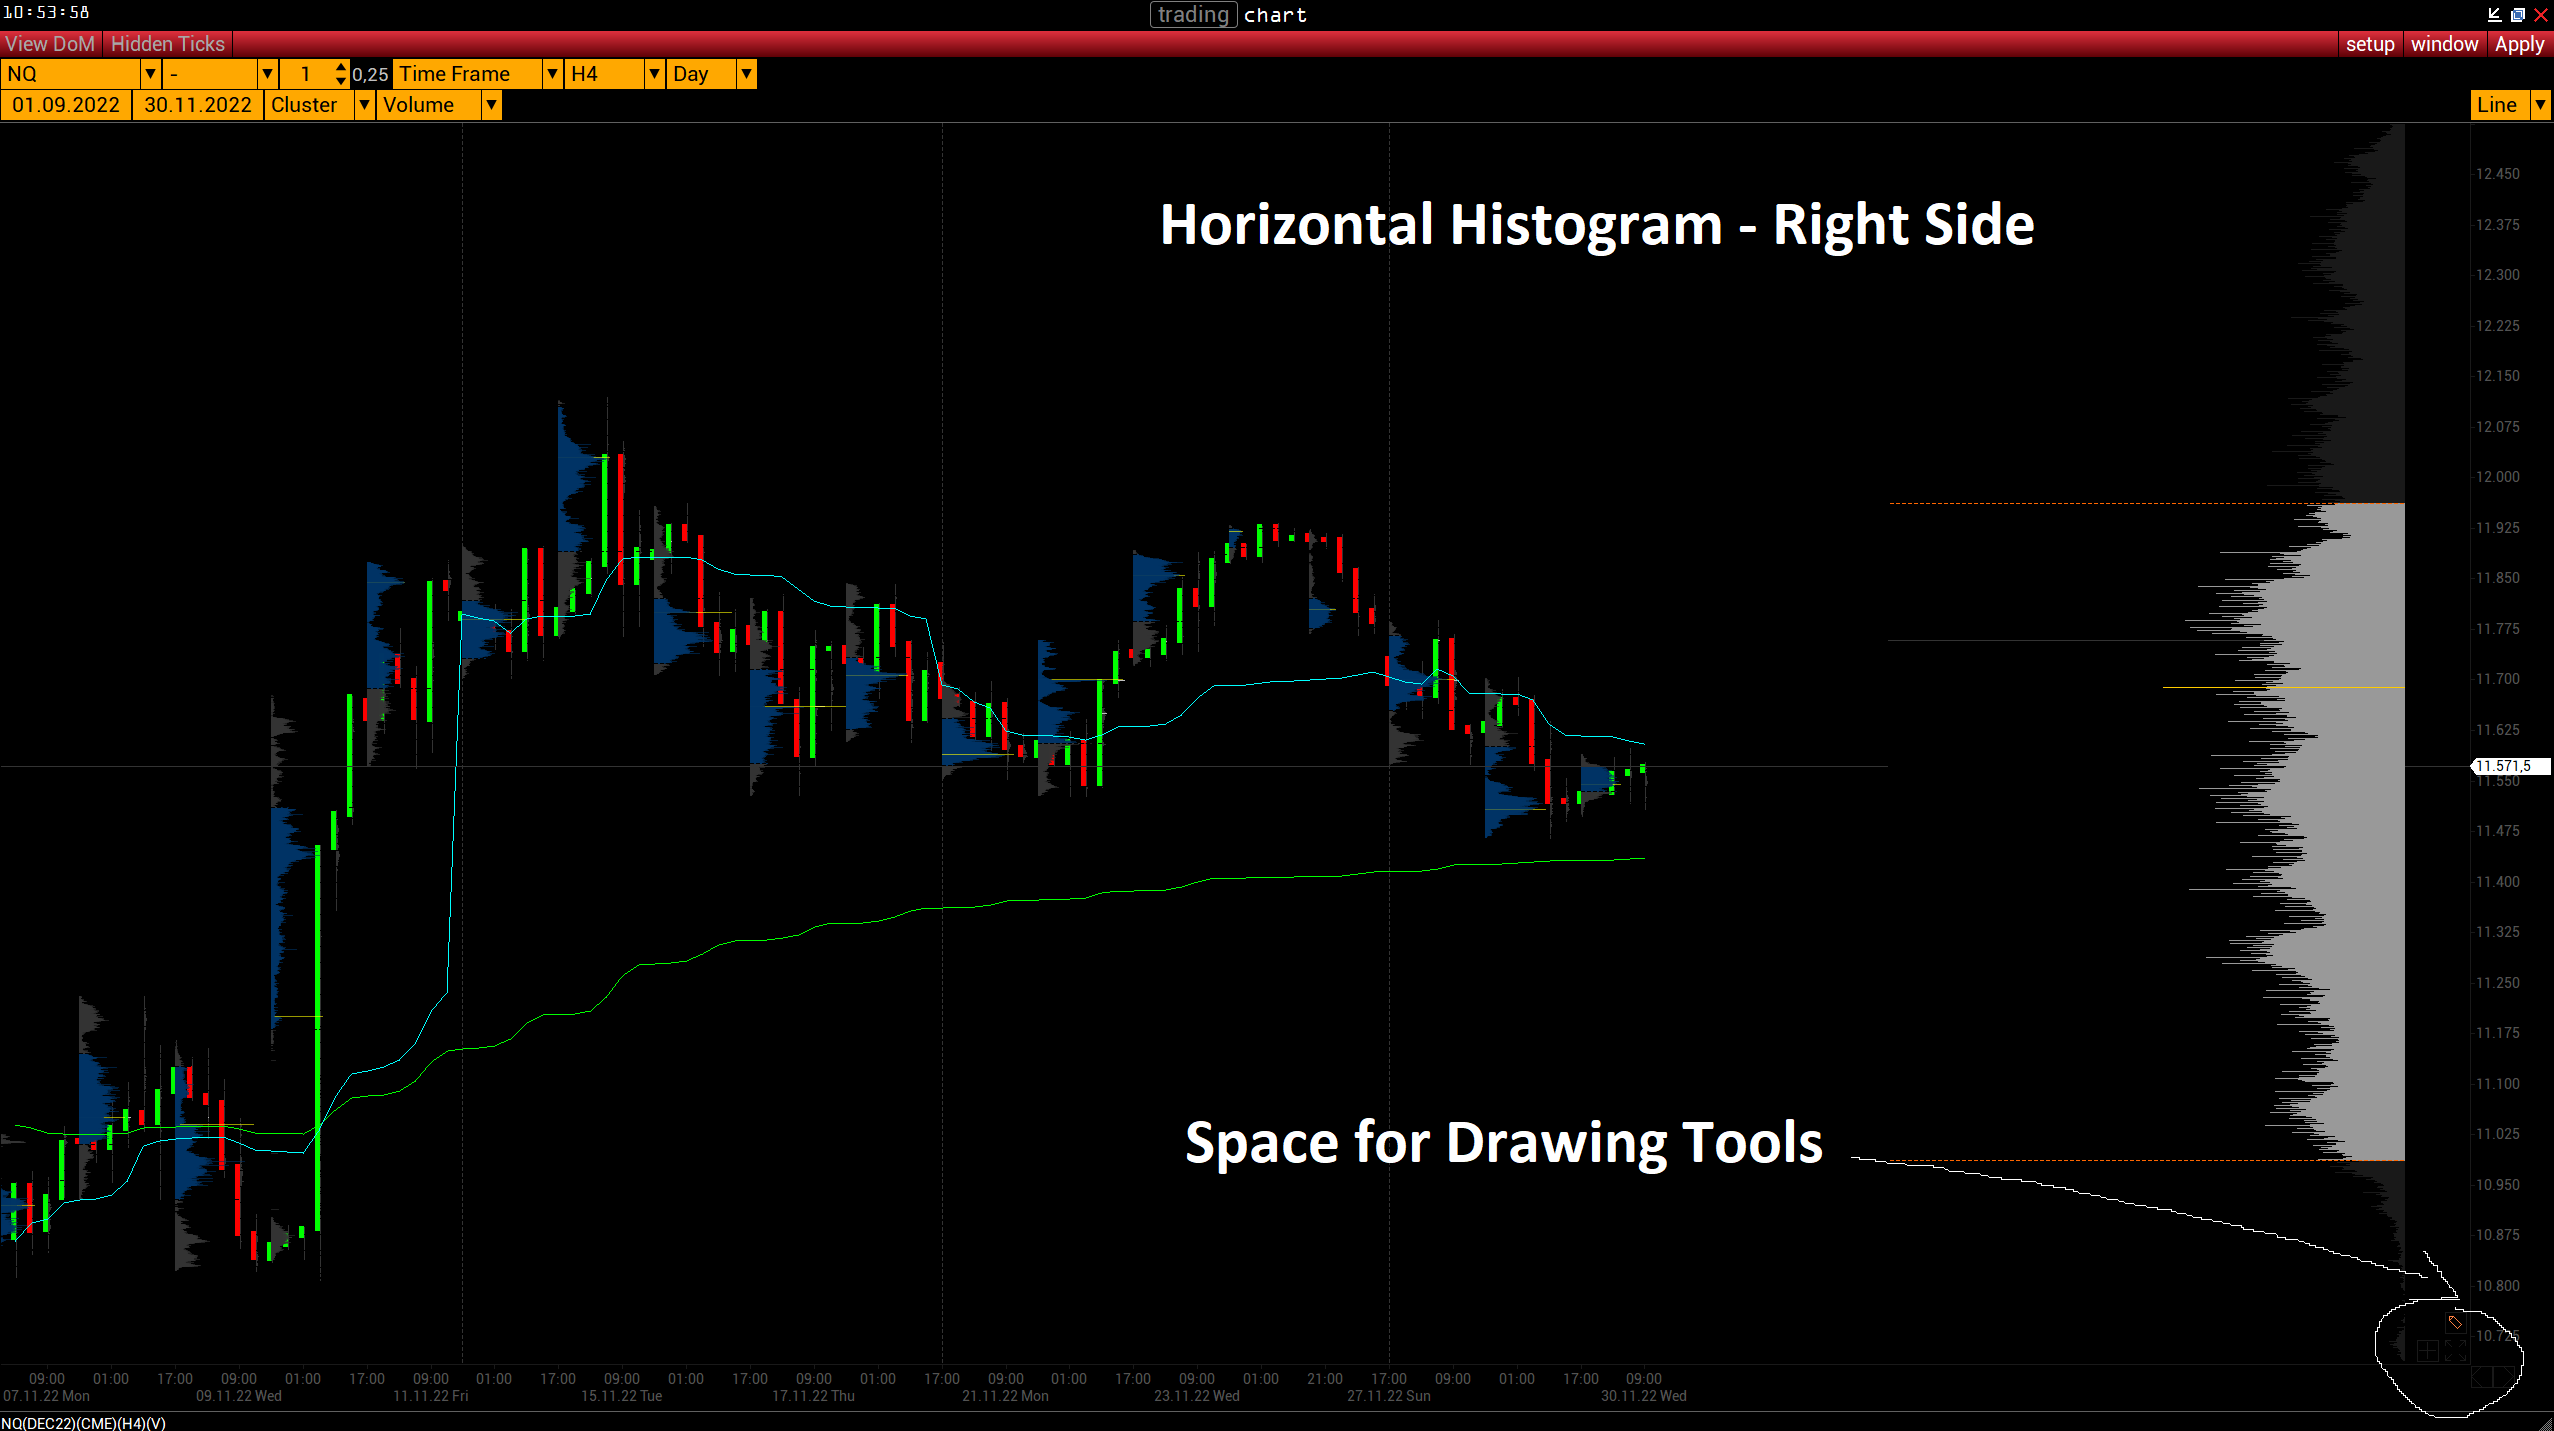
Horizontal Histogram - Left/Right Side
Good evening Volfix Team,
I would like to suggest a setting to place the Horizontal Histogram on the Right Side of the Chart.
It would probably be a good update for all traders who work with Volfix.
(I saw that a old post 3 years ago was declined (Volfix Legacy), is this possible with the new Anywhere Version?)
Thank you for your work an great support :)

Label within the Draw tools
Good day,
would it be possible to add some kind of label to, say, the "Rectangle" or "Line" drawing tool?
Have a nice day
B. Gröschel
Customer support service by UserEcho