
Your comments
Could you please show a corresponding graph. Thank you.
The cumulative volume + profile(p); 14/12/2023
In order to obtain the bullish and bearish cumulative volume waves, with the respective colors, could you please try the following method:
1- selection of a personal profile
2- choice of waves, 2 methods to choose from
click with the mouse, start-end .
selection with vertical bars.
3- choice of colors, calculation and display of results.
4- divergence detection
Simple idea... , possible or not ?... thanks.
Thank you for your work, best regards..
.............................................................................................................................................Sorry ........ Right scale of course.
Hello
Thank you for your comment. This idea dates a little, 2 years !. Since then I have progressed, I hope? . From my current point of view the delta max + and - is not enough. An expert system should offer an analysis of Elliot or Harmonic waves, from one to three indicators, Bollinger Keltner, rsi, or other, a moving average at least, a fine analysis of bid ask volume trades levels lower than one second (absorption rejection. ...), some Japanese candle figures remain valid. A calculation of buy sell climaxes. All of these results should appear in a table or on the graphs ...... the subject is inexhaustible for an enthusiast.
Is a personal application feasible ?. There remains the problem of the flows generated and the price systems of the servers, dedicated line, mob, proximity to Chicago centers or other ... While waiting for the latest Volfix version, for the moment I use several programs. To read you, thank you.
Font size: Hello, could you test again please , thanks.
Hi,
Could you consider the second option:
Left Graph + Vwap ; Time from 10h40 to : 23h59
Add a second Vwap with ; Time from : -H----Mn to :------H--------Mn on this left graph
Thanks.
No such error with Volfix.
The error comes from this program which runs on metatrader; do you have any idea how to intervene and resolve this problem? .thanks in advance.
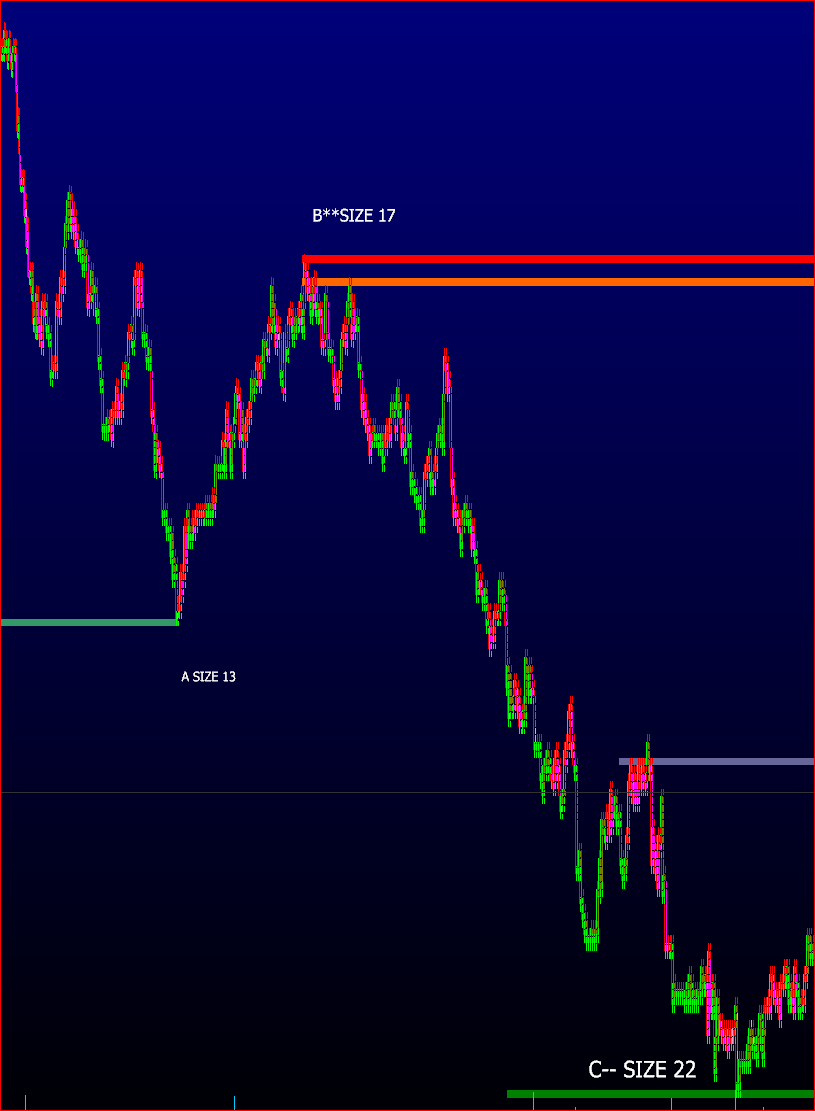
I input numbers A B C , the size of the letter increase without intervention from me.
I use a program (waves elliott calculation) at the same time with metatrader , sometimes I get an error like: "Access violation at adress ...."; no solution for several years. Would this program be responsible?.
Customer support service by UserEcho
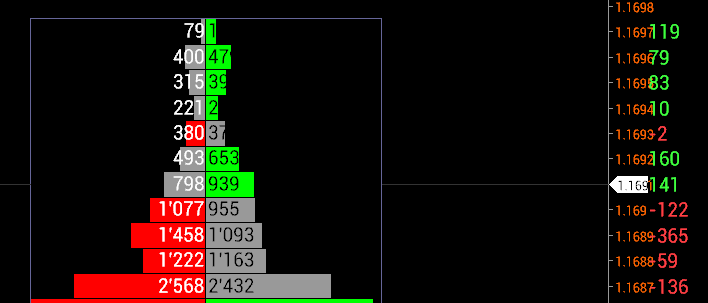
Cumulative volume profile continued. December 27, 2023
We could test the limit orders placed, in the form of a line or histogram, associated with the cumulative volume; with choice of normal histogram, delta, cumulative. A vertical histogram of limit orders would be a plus. Many possibilities exist, they could complete the vertical delta which often remains limited. Thank you for your reply. Sincerely.