
0
Fixed
max min delta line histogram so messed up fix please
Desktop Screenshot 2023.03.11 - 03.28.54.79.png
Hello,
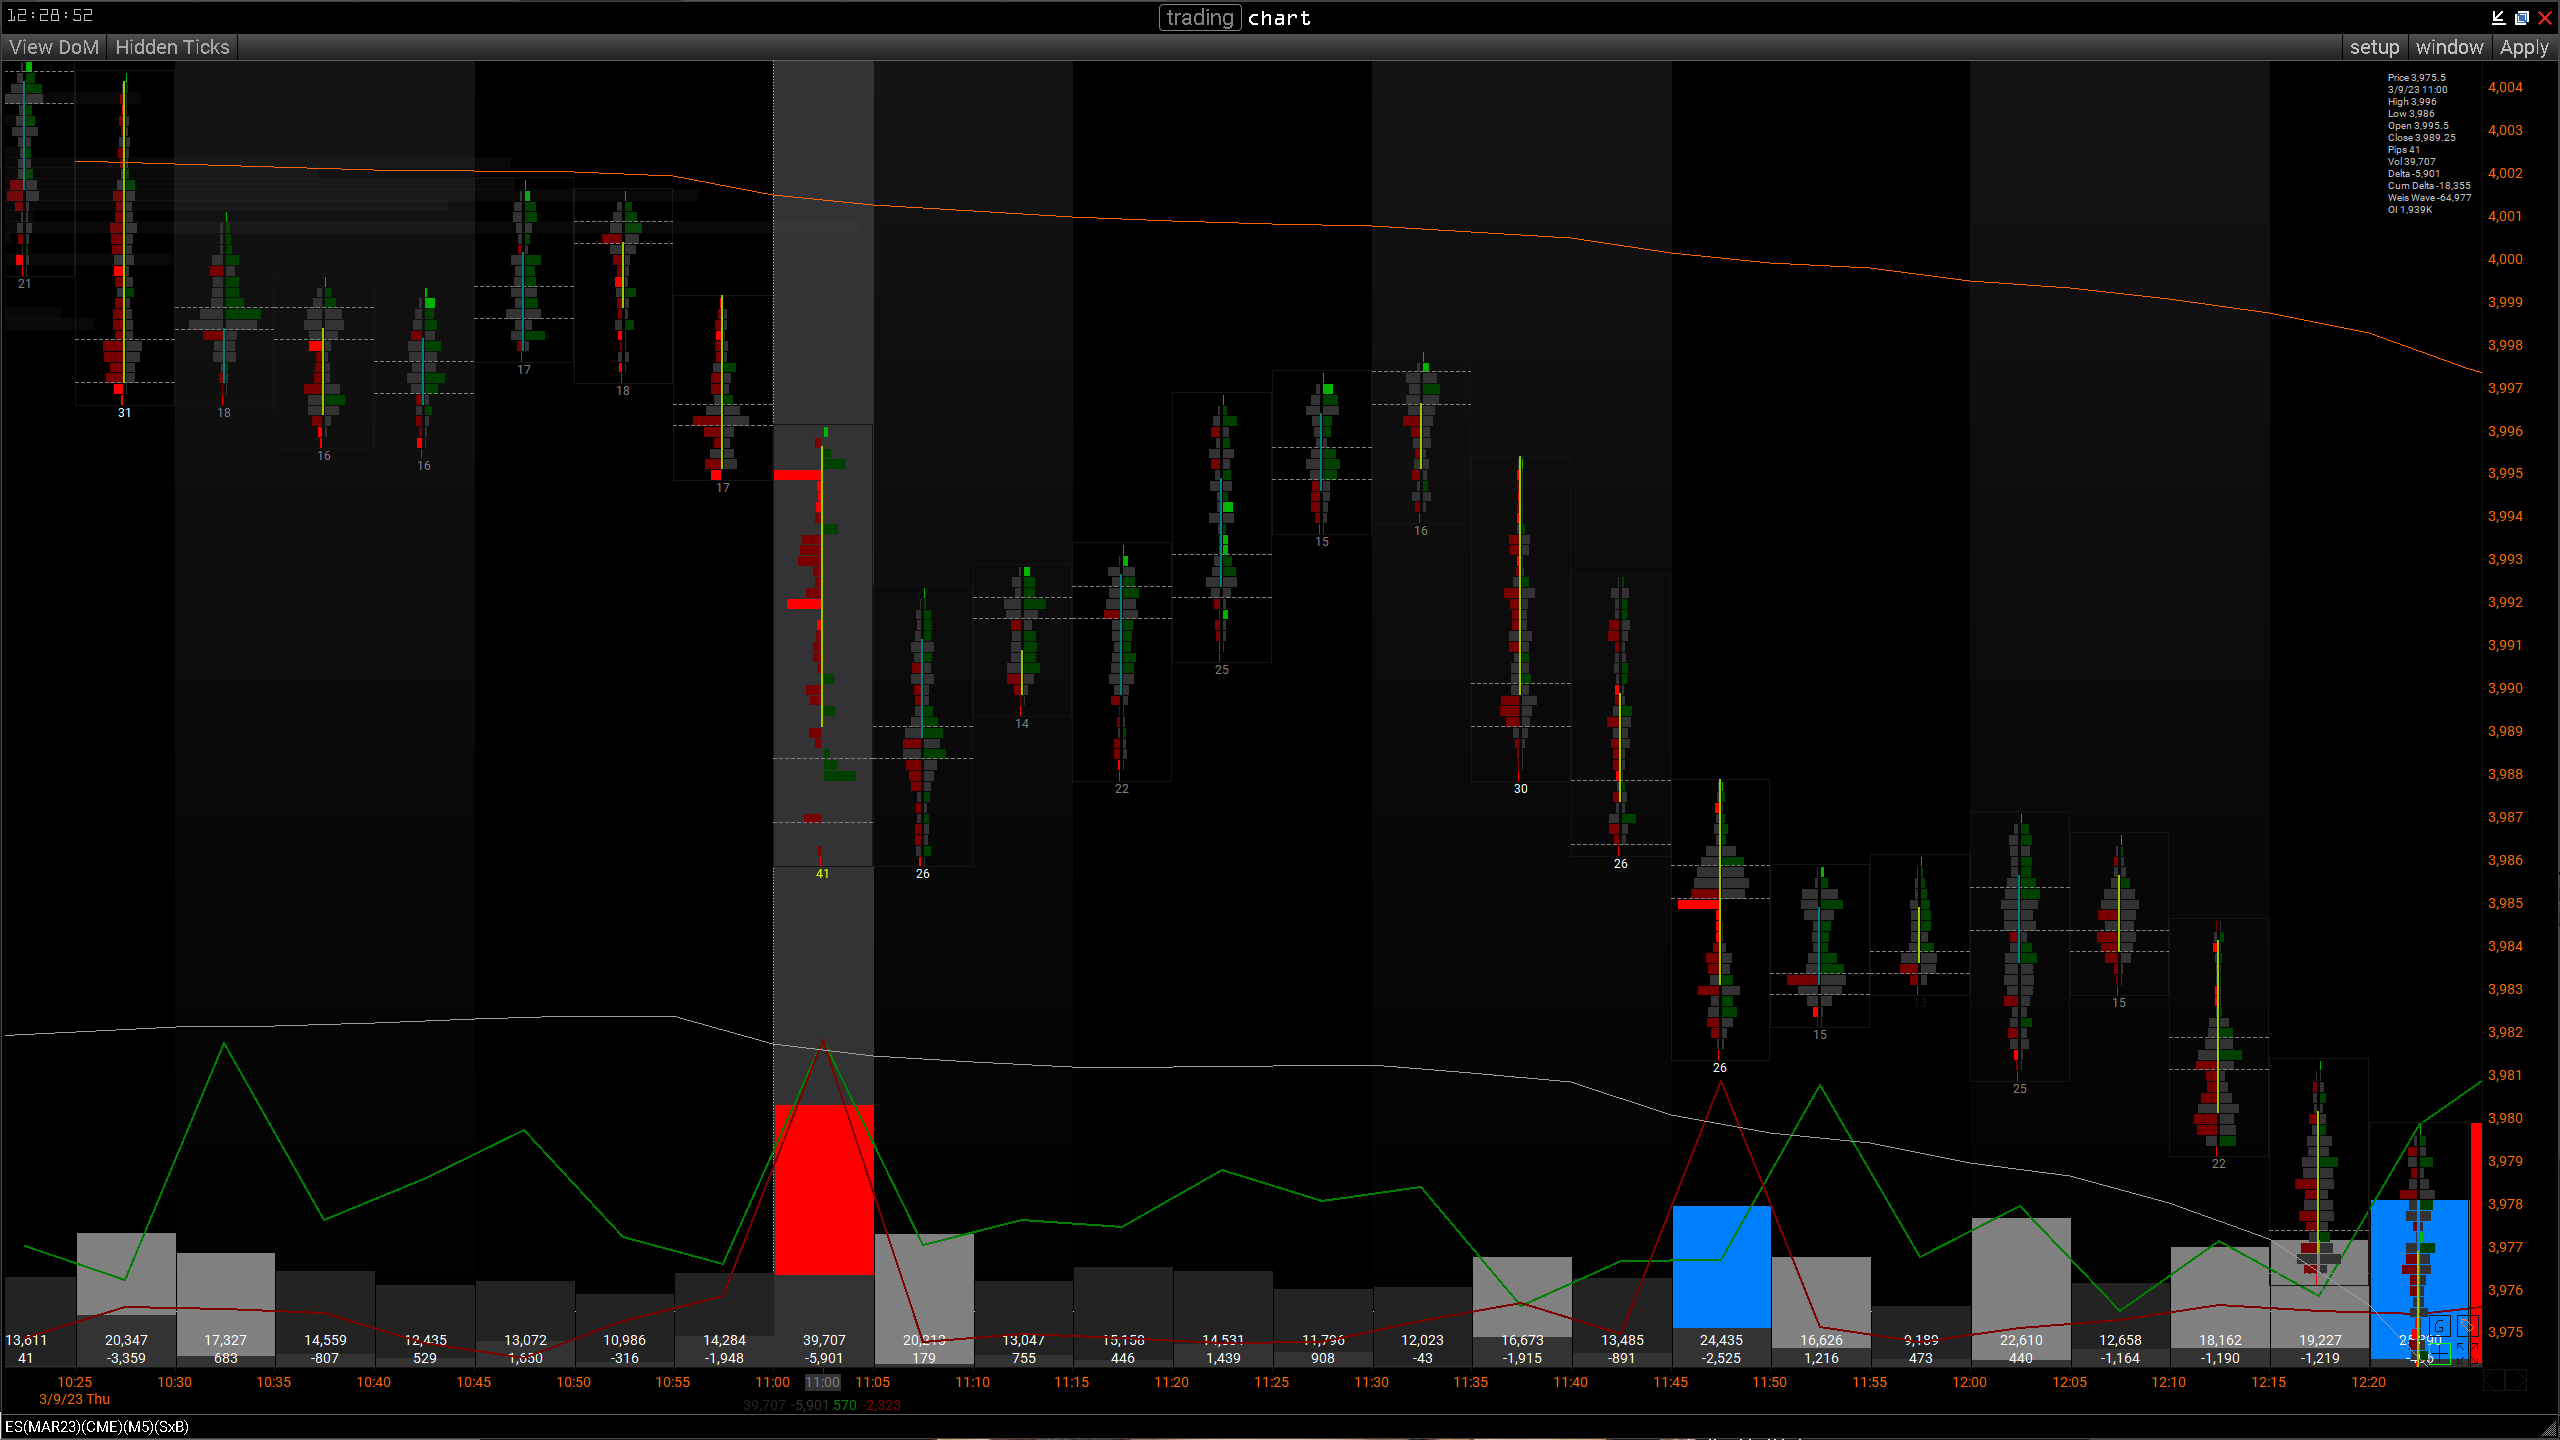
as you can see in this picture min delta was 2000 max delta was 500 but histogram just spiking on the both so complicated to understand have to click on bottom of the chart if i want to see the numbers please solve, why cant be just histogram's like volume,delta instead of line.

0
Under review
support 2 years ago
0
Planned
support 2 years ago
0
Fixed
support 2 years ago
Customer support service by UserEcho