
0
Answered
Candle Stick Chart
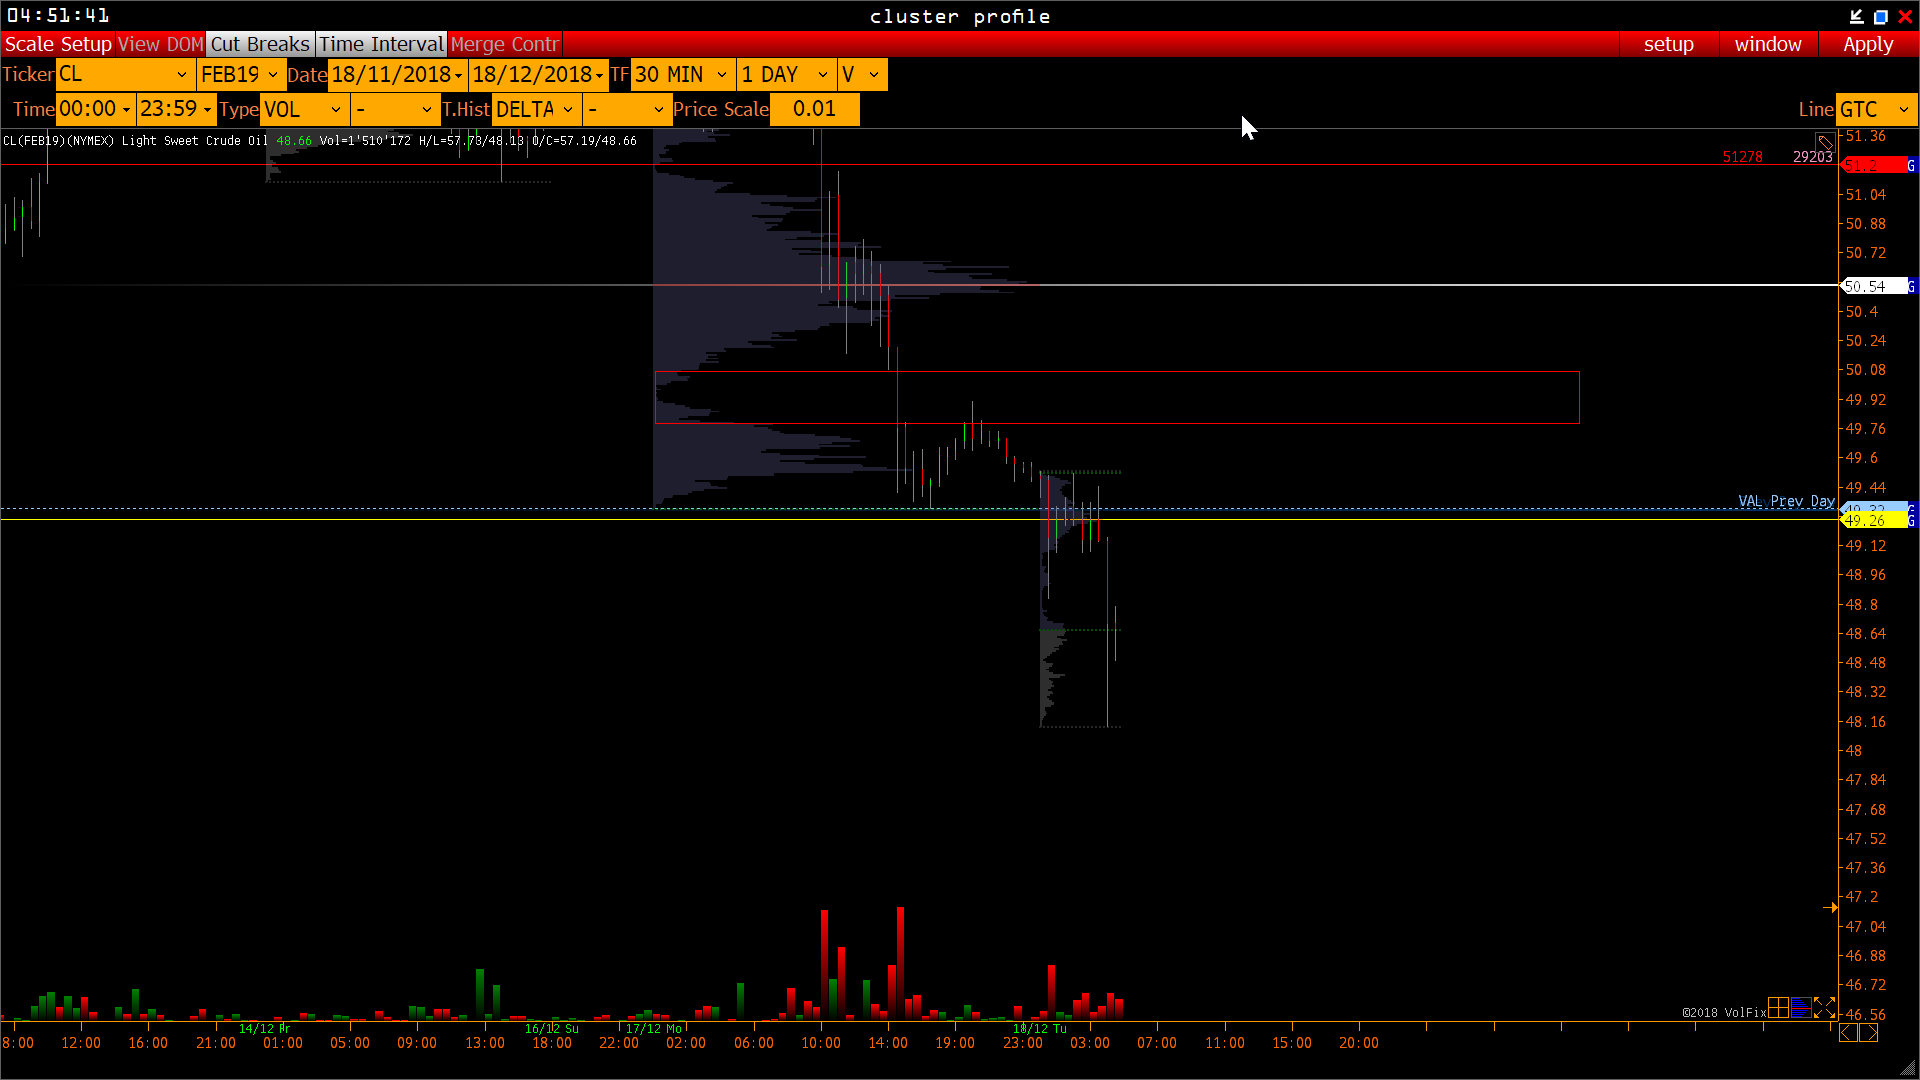
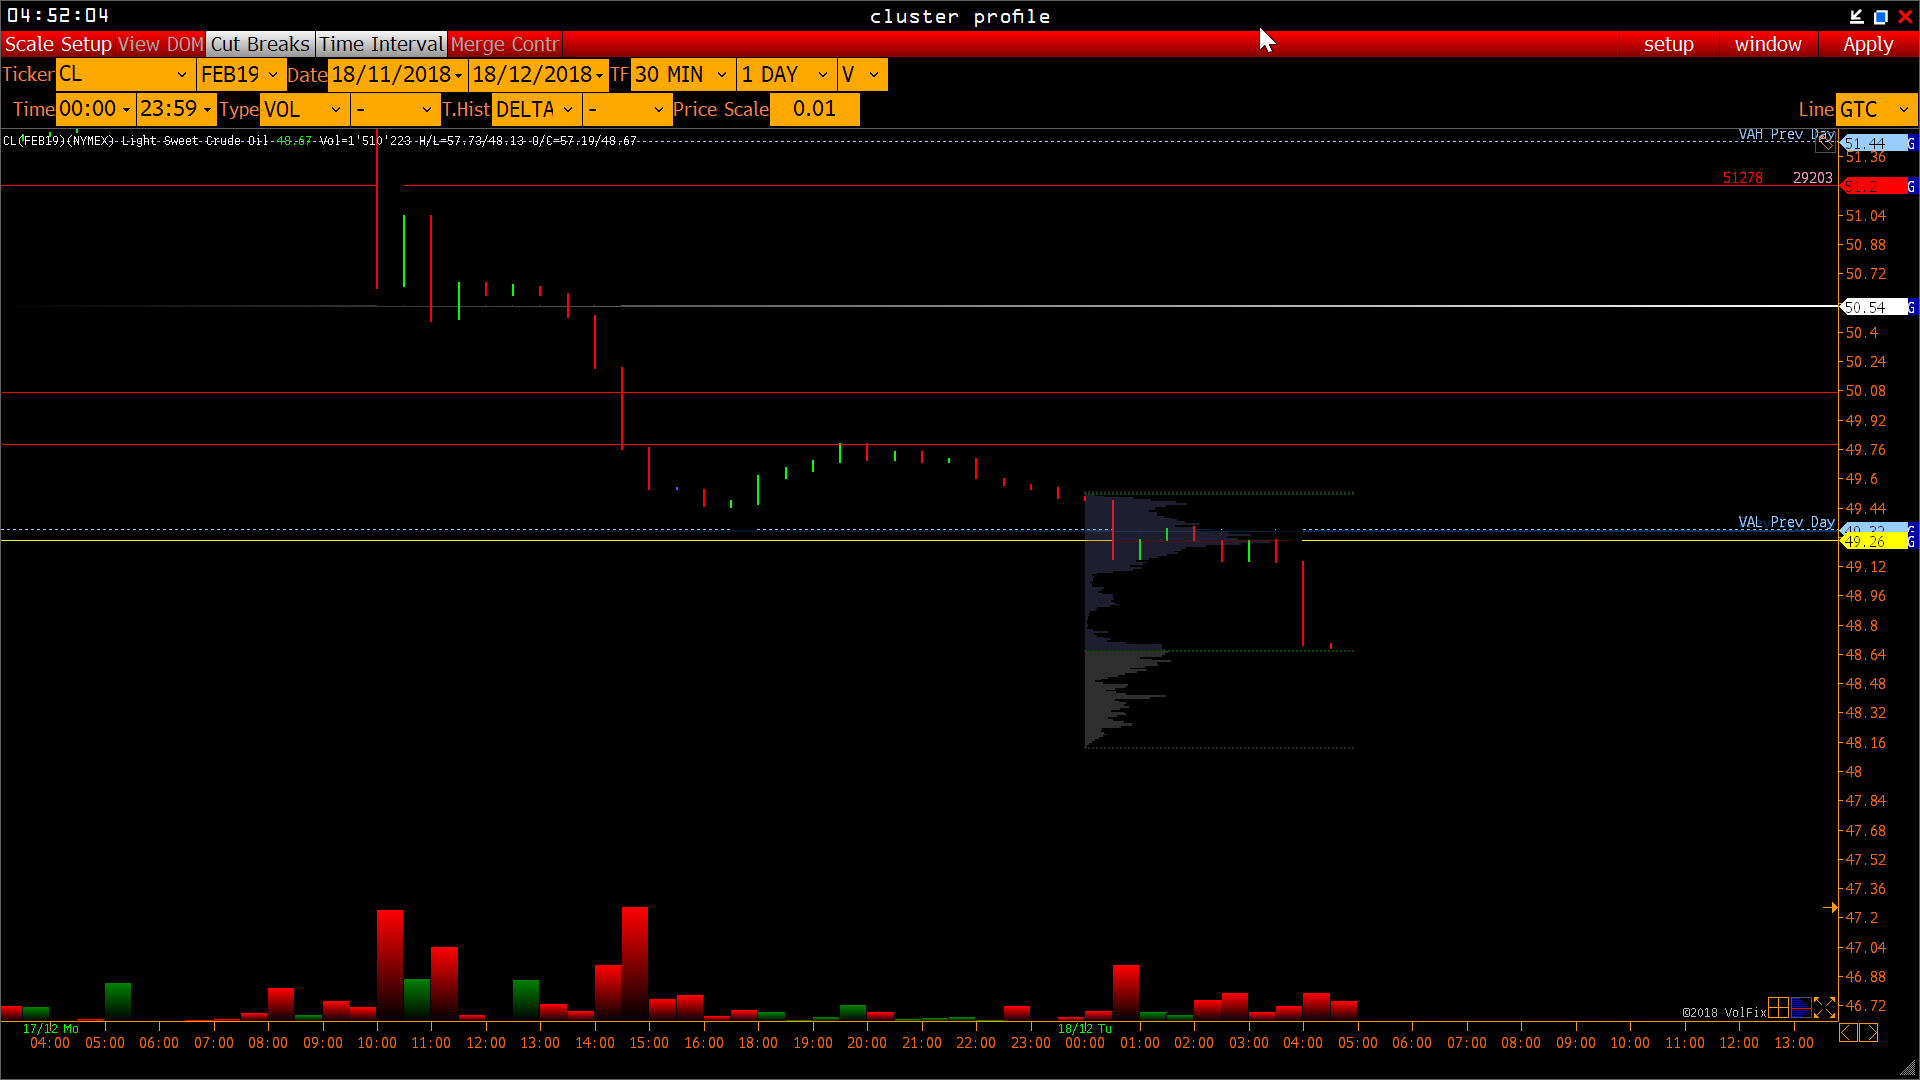
What's the best way to create a candle stick chart? Tried it with the cluster profile but when I stretch it the candle shadow becomes invisible; see pictures.
Customer support service by UserEcho
Hello.
The best way it is use Bar Chart with bar type = open close.
How can I show TF2 in a bar chart? Would like to have the daily volume included.
No real reason of TF2 on bar chart. Because this chart doesn't loaded volume profile data.
With other words - it is not possible I guess.